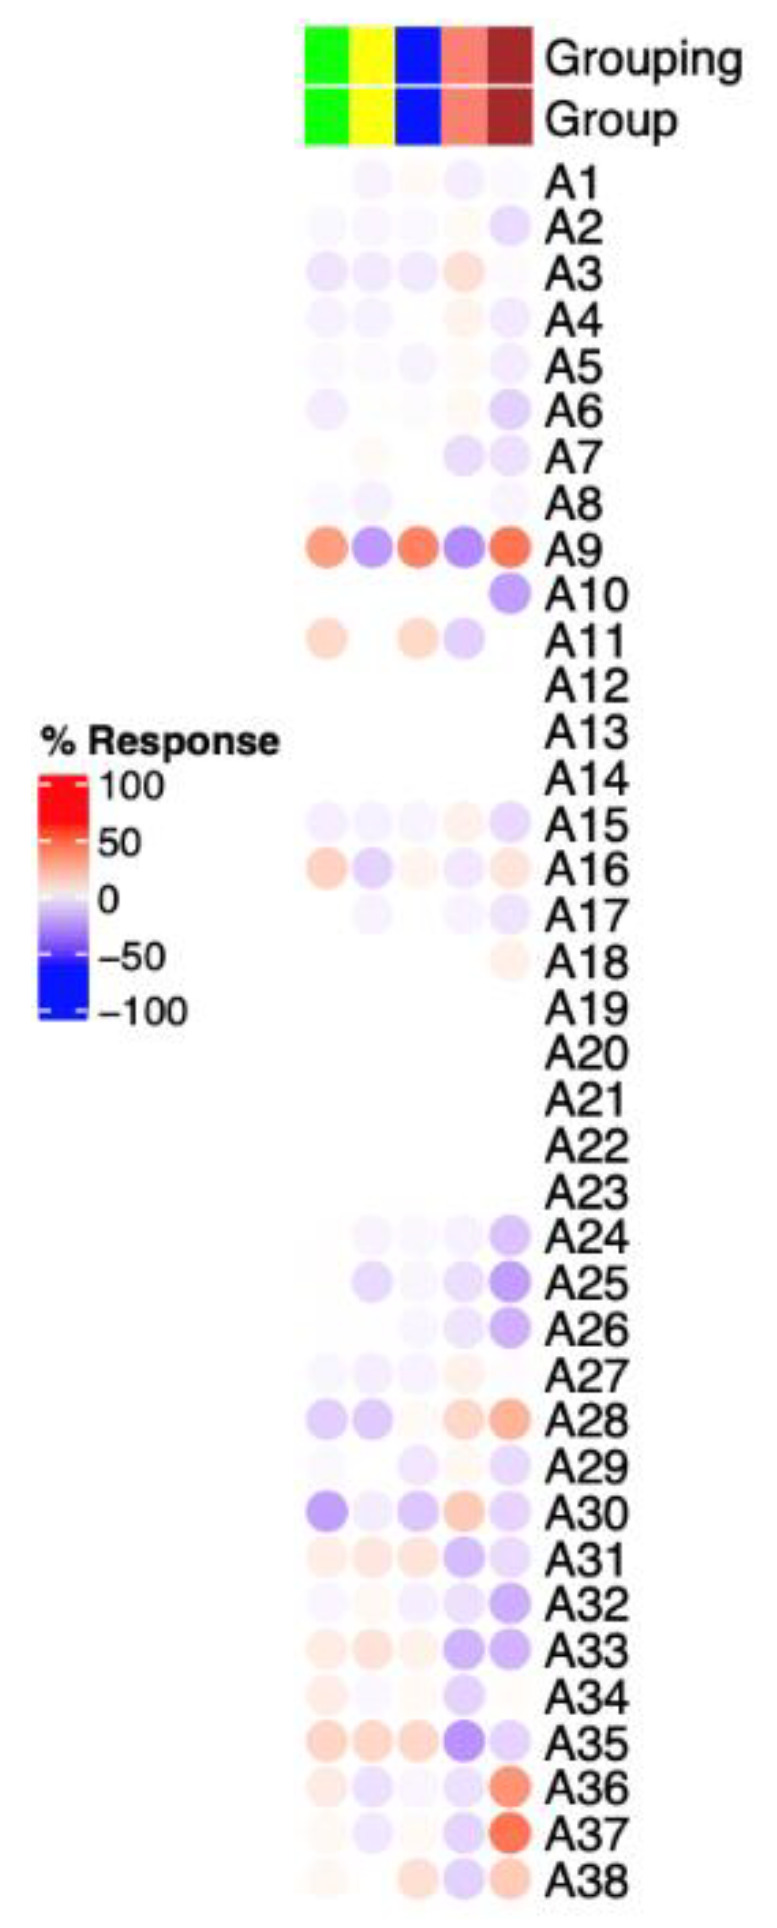
Figure 3.

Mapping of the blood transcriptome signature of LRBA-deficient diabetic patient at the module aggregate level. The columns on this heatmap represent proband, healthy sibling and three healthy controls (from right to left). Module aggregates (A1 to A38) are arranged as rows.
