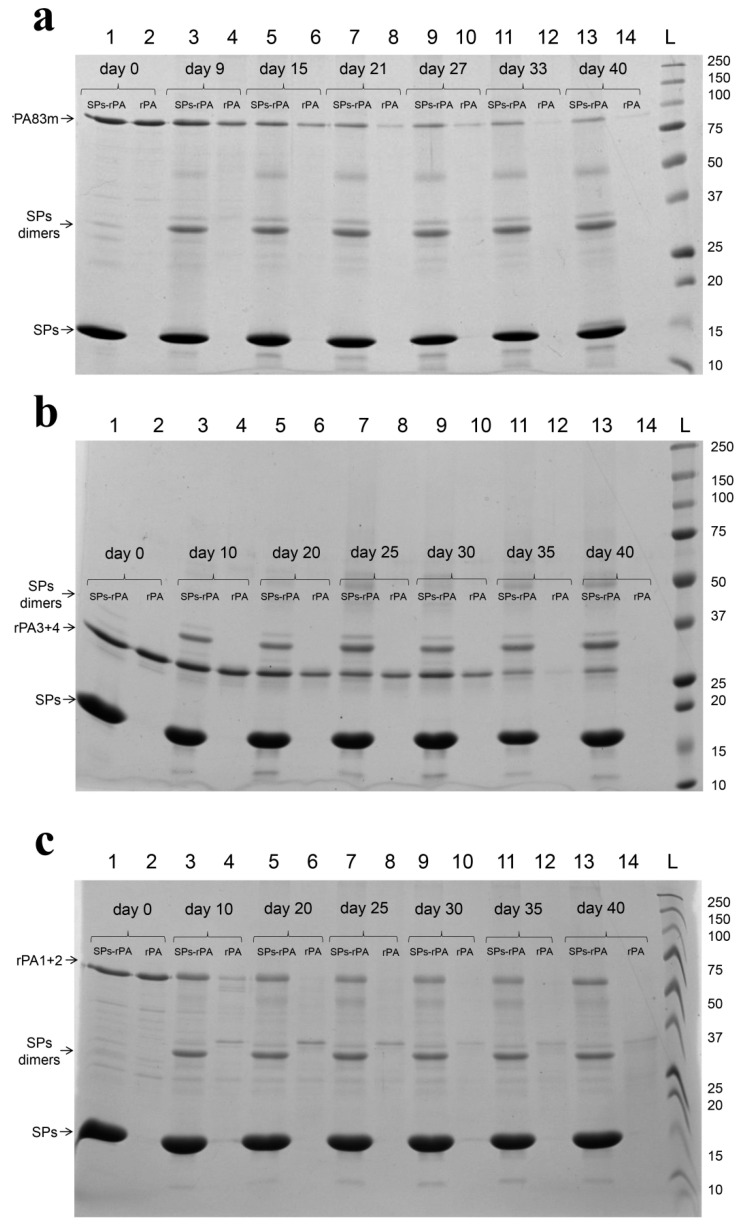
Figure 7.
Comparative stability of SPs-antigen compositions and individual antigens at +37 °C for rPA83m (a), rPA3+4 (b) and rPA1+2 (c). (a)—1, 3, 5, 7, 9, 11, 13—rPA83m within SPs-rPA83m compositions incubated at +37 °C for 0, 9, 15, 21, 27, 33 and 40 days, respectively. 2, 4, 6, 8, 10, 12, 14—Individual rPA83m incubated at +37 °C for 0, 9, 15, 21, 27, 33 and 40 days, respectively. L—Protein molecular weight markers ladder (molecular weights, in kDa, are indicated on the right). (b)—1, 3, 5, 7, 9, 11, 13—rPA3+4 within SPs-rPA3+4 compositions incubated at +37 °C for 0, 10, 20, 25, 30, 35 and 40 days, respectively. 2, 4, 6, 8, 10, 12, 14—Individual rPA3+4 incubated at +37 °C for 0, 10, 20, 25, 30, 35 and 40 days, respectively. L—Protein molecular weight markers ladder (molecular weights, in kDa, are indicated on the right). (c)—1, 3, 5, 7, 9, 11, 13—rPA1+2 within SPs-rPA1+2 compositions incubated at +37 °C for 0, 10, 20, 25, 30, 35 and 40 days, respectively. 2, 4, 6, 8, 10, 12, 14—Individual rPA1+2 incubated at +37 °C for 0, 10, 20, 25, 30, 35 and 40 days, respectively. L—Protein molecular weight markers ladder (molecular weights, in kDa, are indicated on the right). Relative analysis of recombinant proteins degradation rate is presented in Table A1.

