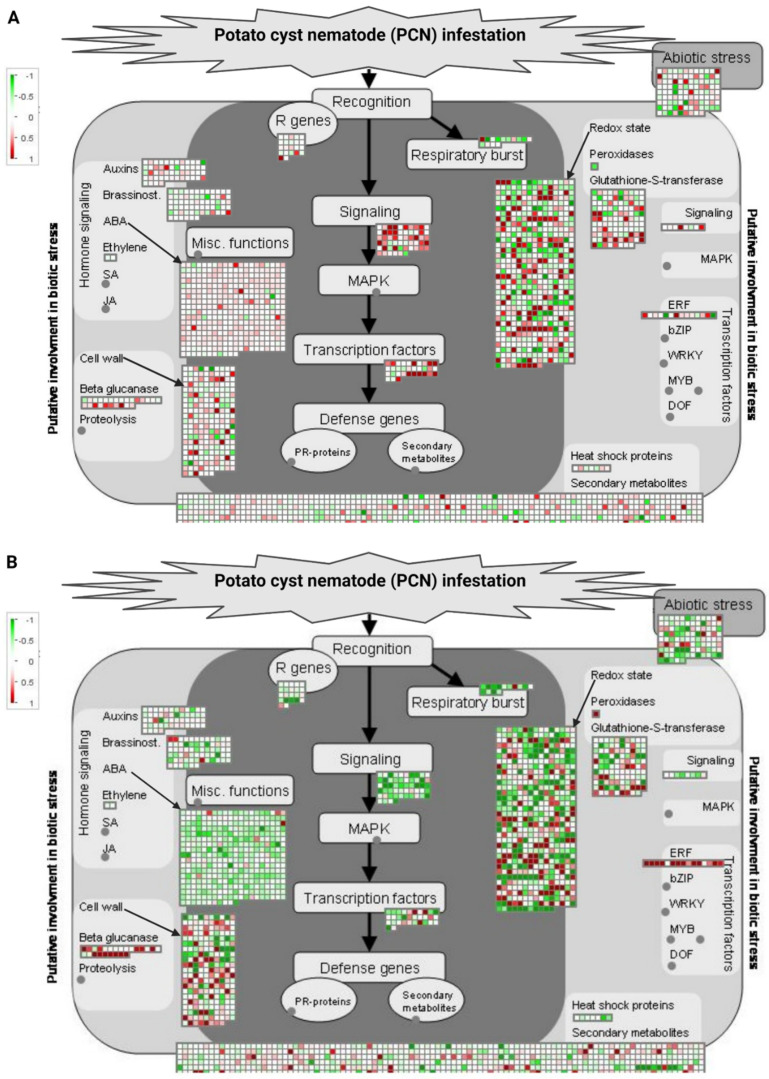
Figure 6.
MapMan visualization of DEGs mapped to the biotic stress pathway in resistant Kufri Swarna (A) and susceptible Kufri Jyoti (B) in response to PCN infestation. DEGs are binned to MapMan functional categories and values are represented as log2 fold change values. Red represents upregulated DEGs and green represents downregulated DEGs. R, response; PR, pathogen-related.

