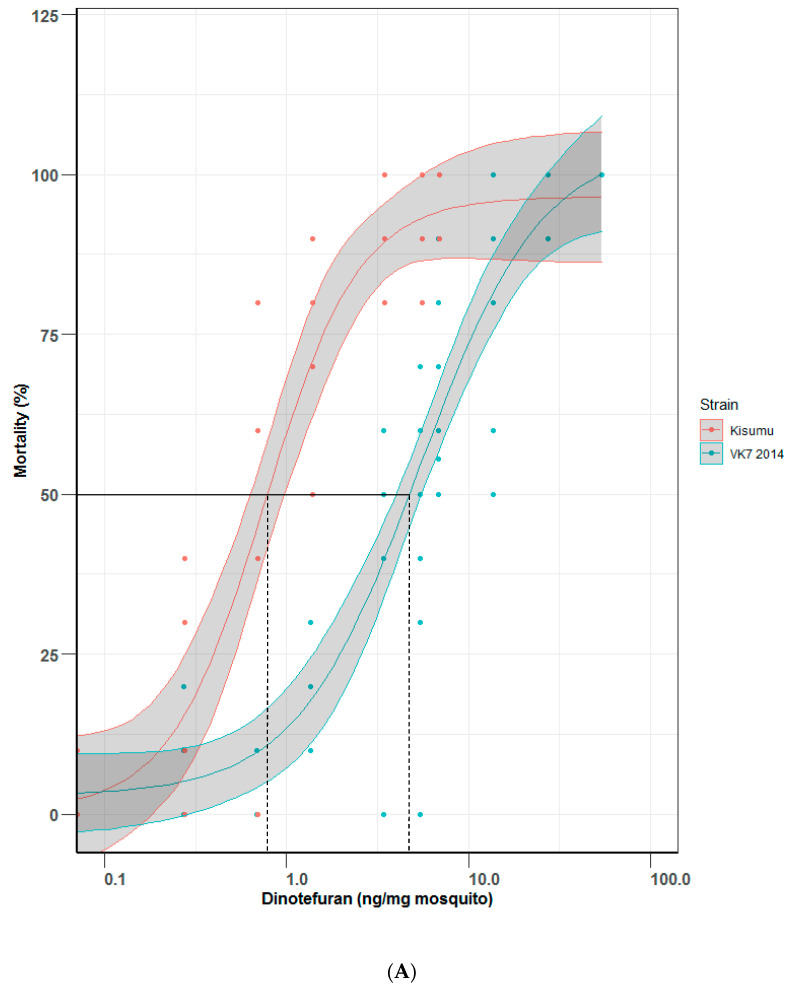
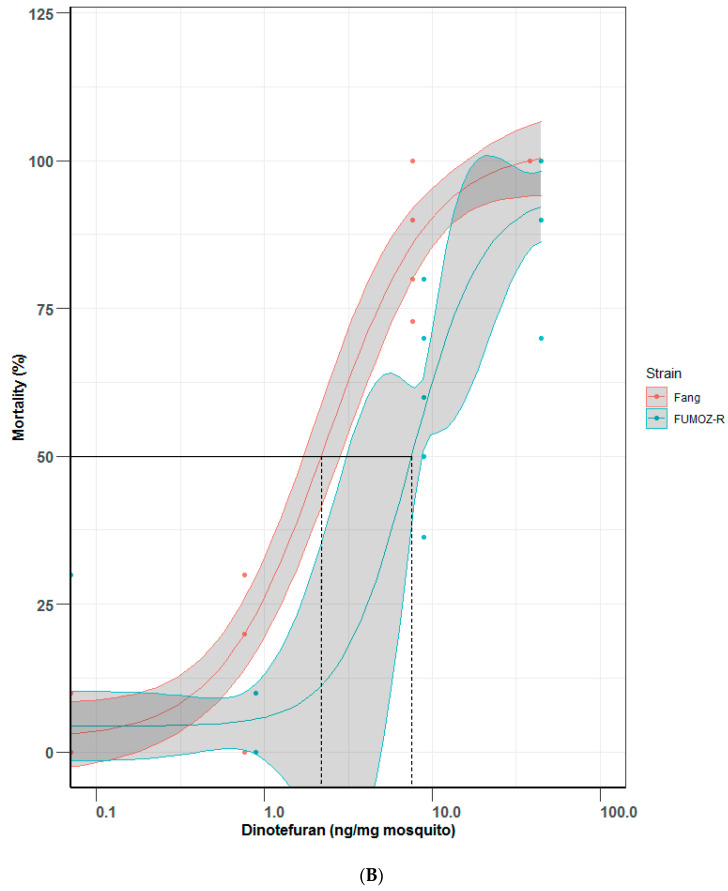
Figure 4.
Mortality comparisons between (A) Kisumu and VK7 2014 strains and (B) Fang and FUMOZ-R strains in a topical application bioassay. Central lines of each curve represent the dose response of each species. Black lines indicate LD50 values on both graphs; red lines show mortality curves of the insecticide susceptible strains of each pair of strains (Kisumu and Fang); blue lines show data for insecticide-resistant strains (VK7 2014 and FUMOZ-R). Shaded areas of each curve represent 95% CI values, generated by R software using the ggplot2 package [13]. (A) omits data for VK7 2014 treated with 136 ng per mg of mosquito, this gave 100% mortality with no variance as did the highest represented range (54 ng per mg of mosquito, refer to Supplementary Material) and so was removed for clarity.


