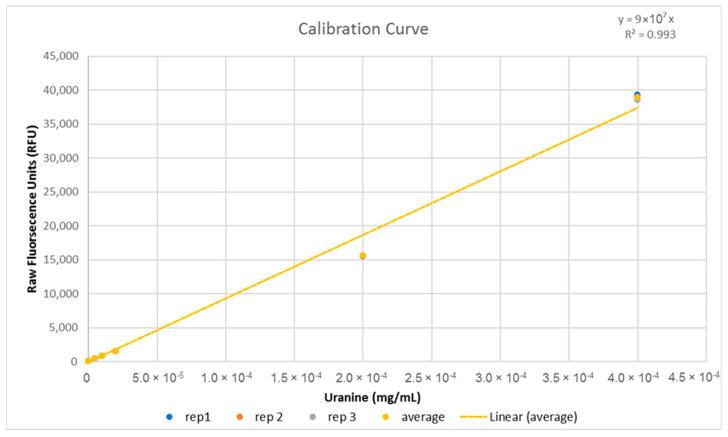
Figure A1.
Calibration curve generated using a stock of 0.8% Uranine (8 mg/mL) in 10% sugar solution diluted into purified water and serially diluted to a suitable range. 2 mL was decanted and read from 10 mL of each concentration three times in the fluorometer to give raw fluorescence units and the average was used to generate the line of best fit. The equation and R2 value of the curve is displayed on the upper right corner of the graph.

