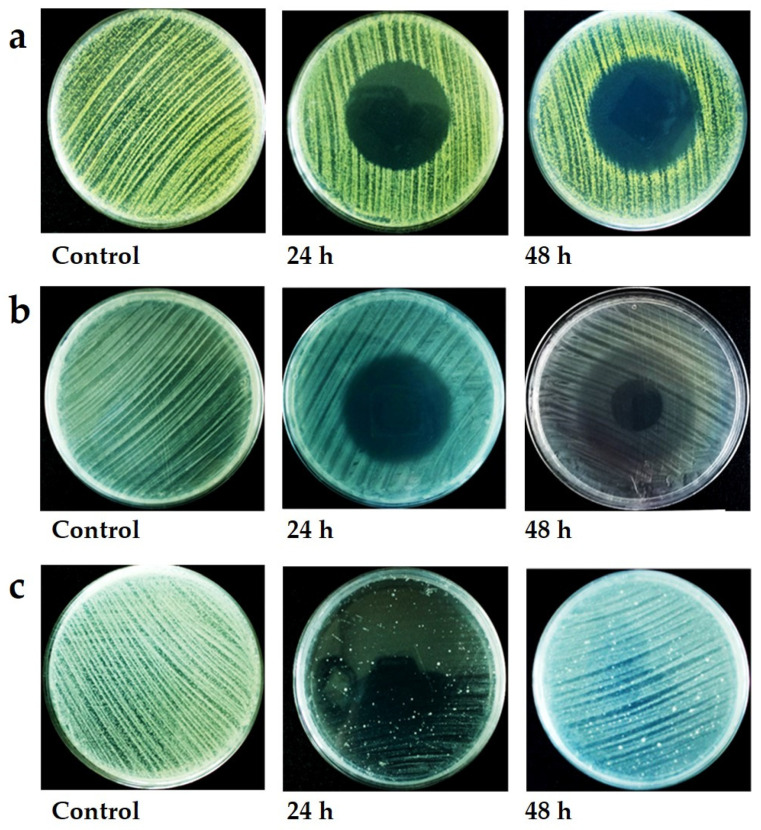
Figure 4.
Appearance of bacterial cultures when exposed to selected volatile organic compounds. (a) M. luteus NCIB 8553 culture exposed to 10 µL isovaleric acid. Note the dense growth at the edge of the inhibition zone. (b) E. coli NCIB 8277 culture exposed to 10 µL isovaleric acid. Note the dense growth in the uninhibited zone and moderate growth in the recovery zone, with a clear zone at the centre where the concentration of the chemical was the highest. (c) B. subtilis NCIP 3610 culture exposed to 10 µL cedrene. Note that the culture was mostly inhibited, except for a few colonies when exposed 24 h to this VOC, but total recovery occurred once the culture was ventilated and allowed to incubate for a further 24 h.

