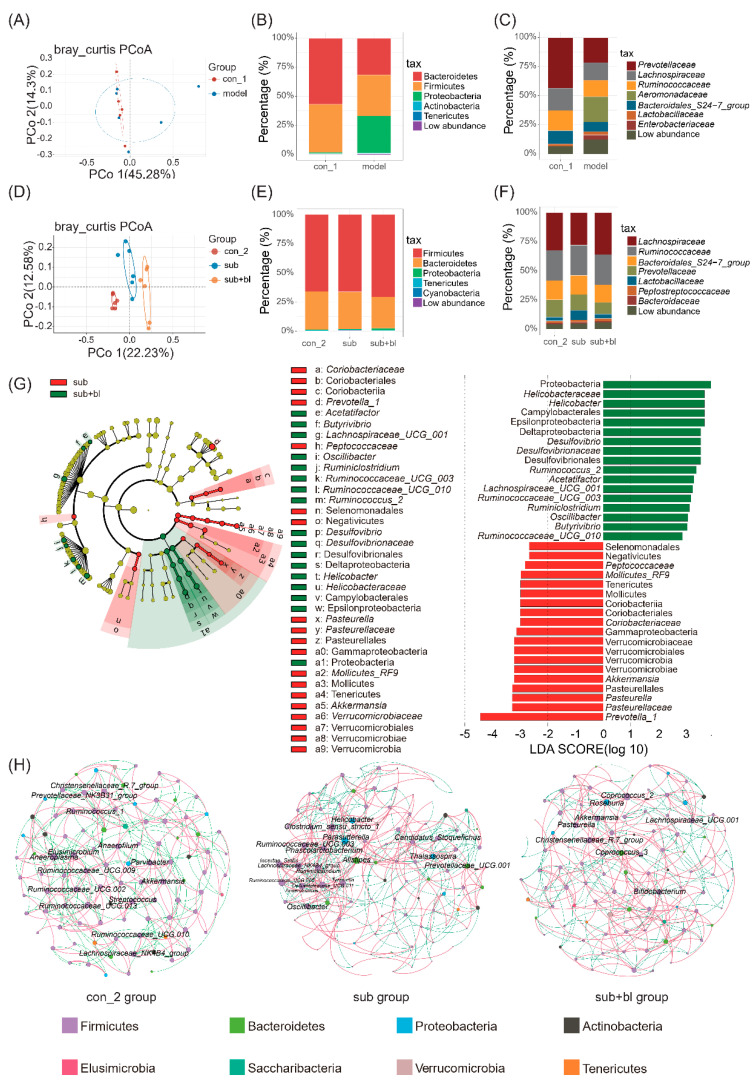
Figure 5.
Changes in the gut microbiota. (A) PCoA of the gut microbiota at the end of the modeling period (B) Composition of the gut microbiota at the phylum level at the end of the modeling period (C) Composition of gut microbiota at the family level at the end of the modeling period (D) PCoA of gut microbiota at the end of the recovery period (E) Composition of the gut microbiota at phylum taxonomic ranking at the end of the recovery period (F) Composition of gut microbiota at family taxonomic ranking at the end of the recovery period (G) LEfSe for comparisons of the subgroup to the sub+bl group: taxonomic tree and effect size histograms (H) Microbial network at the end of the recovery period: the genus with degree >10 are marked. Different colors of the nodes represent different phylum. The red curve shows a positive correlation, and the green curve shows a negative correlation.

