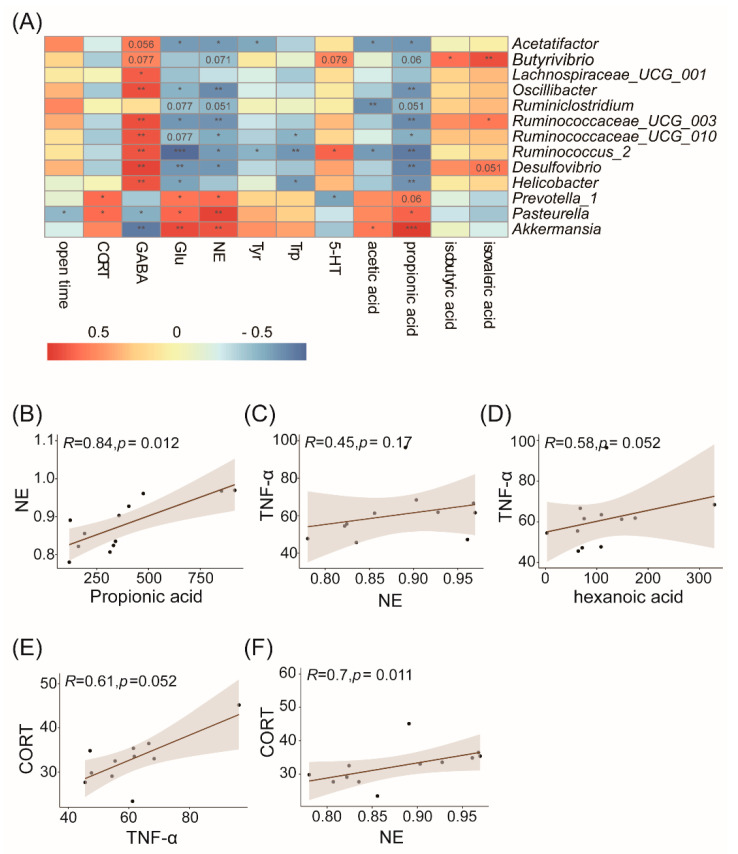
Figure 6.
Correlation among relative abundance of the gut microbiota, and physiological and behavioral indices. (A) Correlation among the genera whose relative abundance changed significantly and the physiological or behavioral indices. The red cell means positive correlation, the blue cell means negative correlation, the value in the cell is the p-value, and the blank cell indicates that the correlation coefficient was not significant. * p < 0.05; ** p < 0.01; *** p < 0.001 (B) Propionic acid and NE (C) NE and TNF-α (D) Hexanoic acid and TNF-α (E) TNF-α and CORT (F) NE and CORT.

