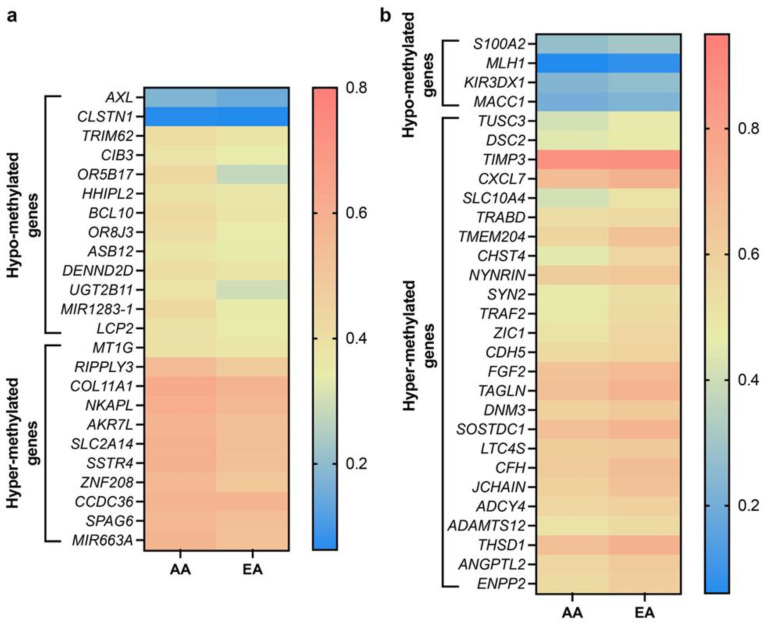
Figure 3.
Heatmaps showing differential methylation pattern of various genes in AA and EA BC patients. (a) Heatmap showing significantly hypo- and hyper-methylated genes higher in AA over EA BC patients. (b) Heatmap showing significantly hypo- and hyper-methylated genes higher in EA over AA BC patients. AA, n = 160, EA, n = 578, p ≤ 0.05. Data were analyzed using graph pad prism 8 software.

