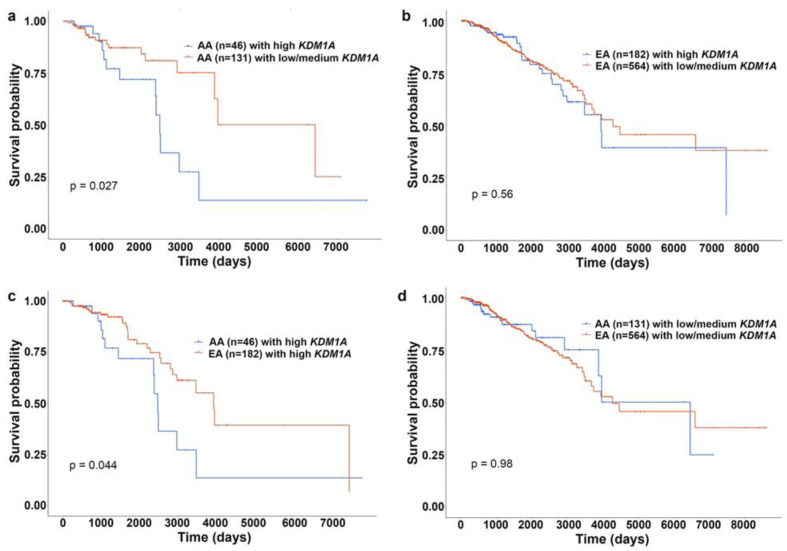
Figure 4.
KM plots showing effect of KDM1A expression on survival of AA and EA patients with BC. (a) KM plot showing survival rates of AA patients with BC with high (blue) and low/medium (red) expression of KDM1A. (b) KM plot showing survival rates of EA patients with BC with high (blue) and low/medium (red) expression of KDM1A. (c) KM plot showing survival rates of AA (blue) EA (red) patients with BC with high expression of KDM1A. (d) KM plot showing survival rates of AA (blue) EA (red) patients with BC with low/medium expression of KDM1A.

