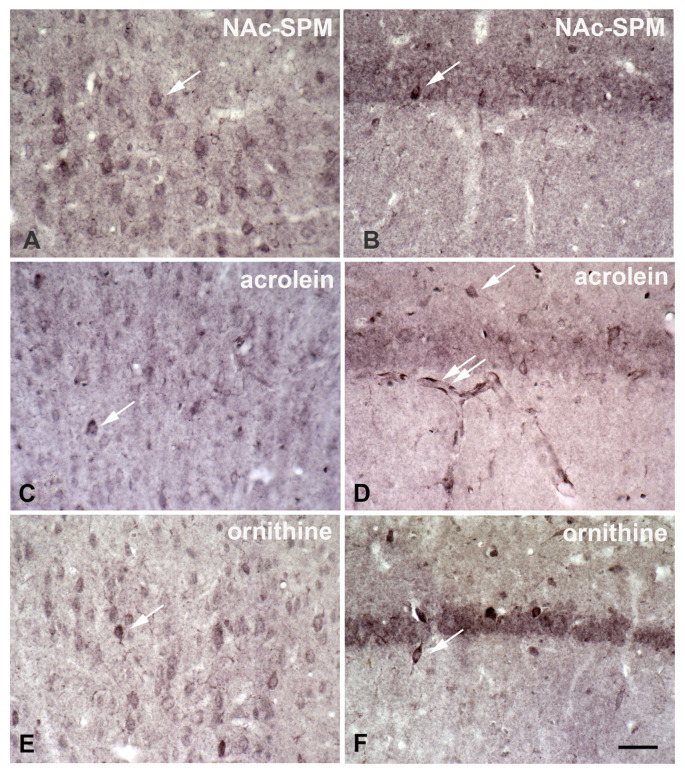
Figure 5.
Immunocytochemical visualization of some components of polyamine metabolism. Coronal sections of rat cortex (A,C,E) and hippocampus (B,D,F) after immunocytochemical visualization of (1) N-acetylspermine, (2) acrolein, and (3) ornithine display staining predominantly in neurons. Antibodies had been raised in the author’s laboratory (1, 3) as described earlier [66] or were obtained from commercial sources (2, rabbit anti-acrolein; LS-C63521, MoBiTec, Göttingen, Germany). All control sections were negative. Surprisingly, immunoreactivity is more pronounced in interneurons (single arrows in all images) as compared to adjacent neurons in all sections. This indicates that there may be considerable differences between separate classes of neurons. Note the strong acrolein-immunoreactivity in capillary walls ((D), double arrow). Bar in (F) indicates 50 µm in all images. Taken from Höhlig et al., this special issue.

