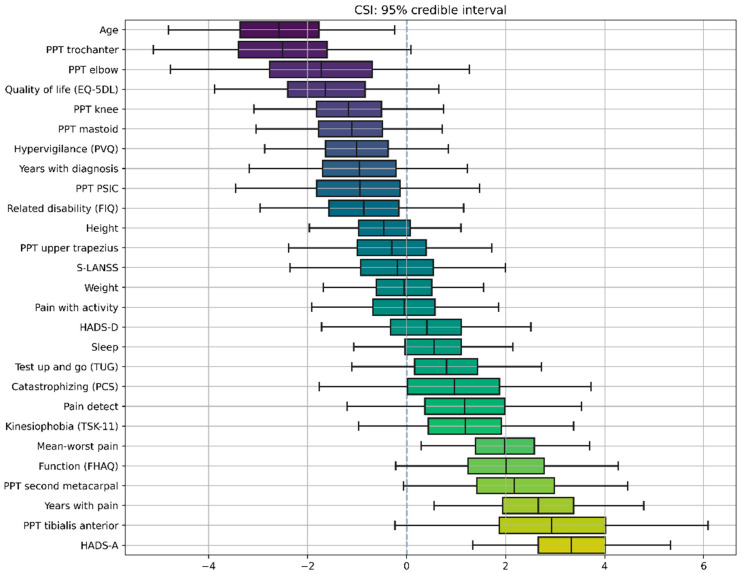
Figure 2.
Credible intervals for all the parameters in the Bayesian Linear Regression (BLR) model for Central Sensitization Inventory (CSI). The X axis represents the values of the coefficients of the model, which are random variables, meaning that they do not have a specific value, but rather a “probabilistic value”, with some values being more probable than others. The negative sign (left side of the figure) means that the correlation with the CSI score is negative. The positive sign (right side of the figure) means that the correlation with the CSI score is positive. The magnitude, e.g., 3.5, indicates the relative strength of that correlation; it is relative in the sense that you can directly compare different coefficients because variables have been standardized. Accordingly, boxplots represent the distribution of a model coefficient, with whiskers enclosing its 95% credible interval. The 95% credible interval of a model coefficient is the range of values within which 95% of its probability falls.

