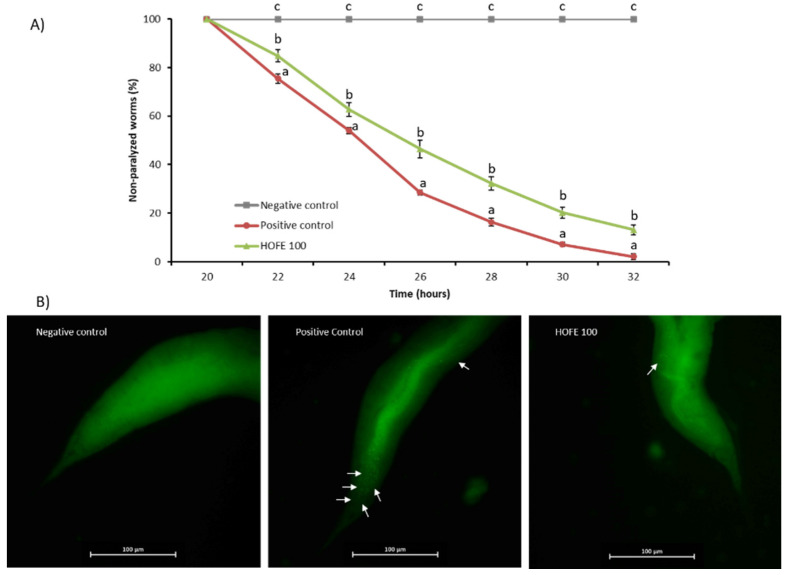
Figure 4.
HOFE (100 μg/mL) effect on Aβ-induced paralysis CL4176 nematodes. (A) Paralysis curve. For each time, different letters represent statistically significant differences (p < 0.05) between groups. Results are expressed as mean ± SEM. (B) Typical images from each experimental group presenting Thioflavin T aggregates in worms at 26 h after temperature shifting (40× magnification). Aβ aggregates are indicated with white arrows. Negative control is represented by the non-paralyzable strain CL802. Positive control is the non-treated CL4176.

