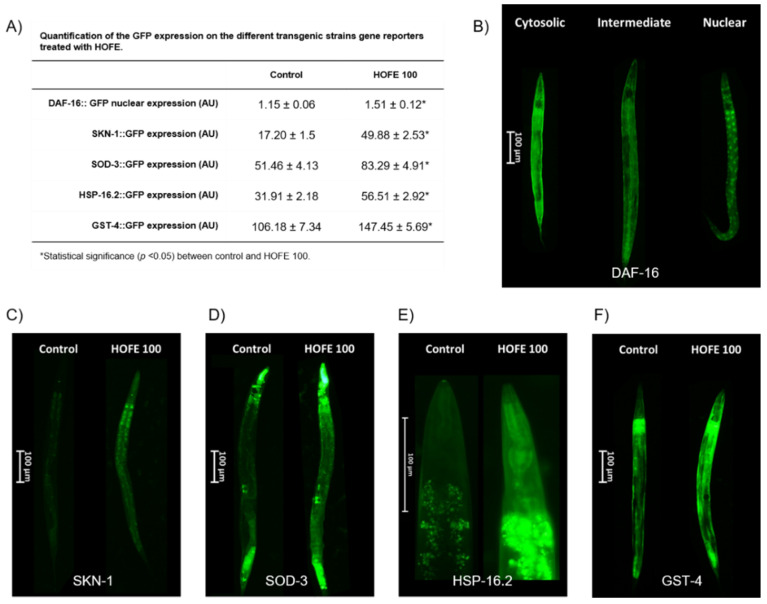
Figure 7.
Effects of the 100 μg/mL HOFE on transgenic worms. (A) GFP quantification. (B) Representative pictures of DAF-16::GFP categorization. (C) Representative pictures of SKN-1::GFP worms. (D) Representative pictures of SOD-3::GFP nematodes. (E) Representative pictures of HSP-16.2::GFP worms. (F) Representative pictures of GST-4::GFP nematodes. Results are presented as the mean ± standard error of the mean. * Significant difference (p < 0.05) vs. control.

