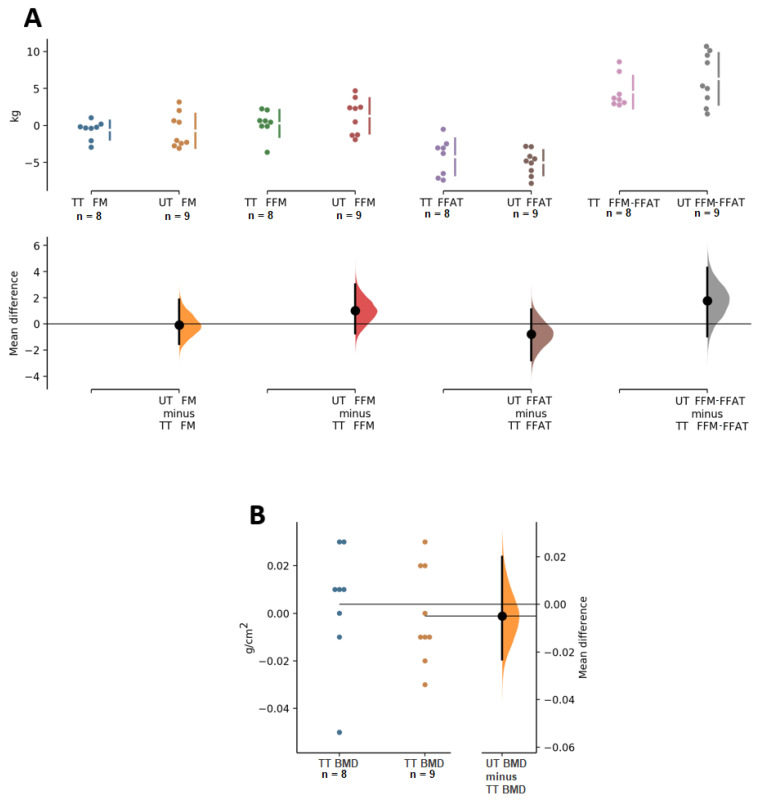
Figure 3.
Paired Cumming estimation plots of body composition variables. (A) FM, fat mass; FFM, fat free mass; FFAT, Fat-free adipose tissue, and FFM-FFAT, fat free mass corrected for fat-free adipose tissue. (B) BMD, bone mineral density. TT, traditional training; UT, undulating training. Both groups are plotted on the left axes; the mean difference is plotted on a floating axis on the right as a bootstrap sampling distribution. The mean difference is depicted as a dot; the 95% confidence interval is indicated by the ends of the vertical error bar [28].

