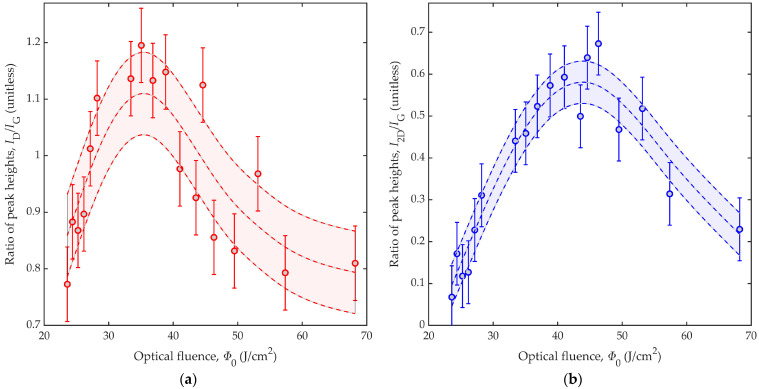
Figure 5.
Results from Raman spectroscopy are shown for LIG lines generated with varied optical fluence, Φ0. The results show ratios of peak heights versus optical fluence, Φ0, for the (a) D-to-G peak height ratio, ID/IG, and (b) 2D-to-G peak height ratio, I2D/IG. The results are characterized by markers and error bars, as well as curves for the fit (middle curve), the fit minus the standard deviation (lower curve), and the fit plus the standard deviation (upper curve). Thus, the shaded regions between the lower and upper curves portray uncertainty at one standard deviation from the fit.

