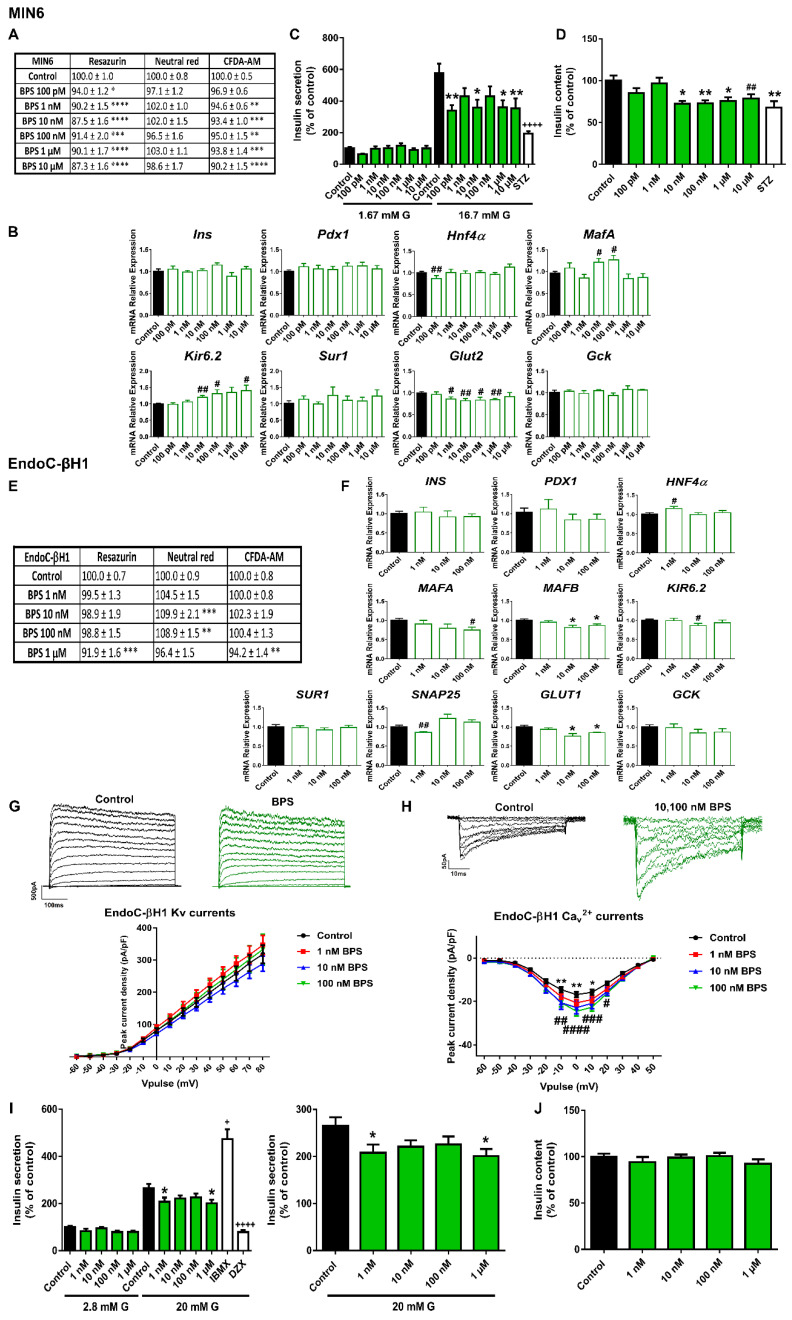
Figure 2.
BPS effects on pancreatic β-cells. (A) Viability of MIN6 cells treated for 24 h with different BPS concentrations (100 pM–10 μM) as evaluated by RZ, NRU and CFDA-AM assays. n = four independent experiments. * vs. Control; one-way ANOVA or Kruskal-Wallis. (B) mRNA expression of Ins, Pdx1, Hnf4α, MafA, Kir6.2, Sur1, Glut2, and Gck in MIN6 cells treated for 24 h with different BPS concentrations (100 pM–10 μM). n = three independent experiments. # vs. Control; Student’s t-test. (C) Effects of BPS (100 pM–10 μM) on GSIS in MIN6 cells treated for 24 h. n = five independent experiments. * vs. Control 16.7 mM G; two-way ANOVA. + vs. Control 16.7 mM G; Kruskal-Wallis. (D) MIN6 insulin content after 24 h BPS treatment. n = five independent experiments. * vs. Control; one-way ANOVA. # vs. Control; Student’s t-test. (E) Viability of EndoC-βH1 cells treated for 48 h with different BPS concentrations (1 nM–1 μM) as evaluated by RZ, NRU and CFDA-AM assays. n = four independent experiments. * vs. Control; one-way ANOVA. (F) mRNA expression of INS, PDX1, HNF4α, MAFA, MAFB, KIR6.2, SUR1, SNAP25, GLUT1, and GCK in EndoC-βH1 cells treated for 48 h with different BPS concentrations (1 nM–100 nM). n = three independent experiments. * vs. Control; Kruskal-Wallis. # vs. Control; Student’s t-test. (G) Upper panel, representative recordings of K+ currents in response to depolarizing voltage pulses in Control or BPS (1 nM–100 nM) EndoC-βH1 treated-cells for 48 h. Lower panel, relationship between K+ current density and the voltage of the pulses. Control (n = 27) and BPS (n = 13–20 per condition) cells. (H) Upper panel, representative recordings of Ca2+ currents in response to depolarizing voltage pulses in Control or BPS (1 nM–100 nM) EndoC-βH1 treated-cells for 48 h. Lower panel, relationship between Ca2+ current density and the voltage of the pulses. Control (n = 12) and BPS (n = 11–12 per condition) cells. * Control vs. 10 nM BPS and # Control vs. 100 nM BPS; two-way ANOVA. (I) Effects of BPS (1 nM–1 μM) on GSIS in EndoC-βH1 cells treated for 48 h. Left panel: GSIS in response to low glucose (2.8 mM G) and high glucose (20 mM G). Right panel is an inset graph that shows insulin release in response to 20 mM G. n = five independent experiments. * vs. Control 20 mM G; two-way ANOVA. + vs. Control 20 mM G; Kruskal-Wallis. (J) EndoC-βH1 insulin content after 48 h BPS treatment. n = five independent experiments. All data are expressed as mean ± SEM. Significance * p < 0.05, ** p < 0.01, *** p < 0.001, and **** p < 0.0001; # p < 0.05, ## p < 0.01, ### p < 0.001, and #### p < 0.0001; + p < 0.05, and ++++ p < 0.0001.

