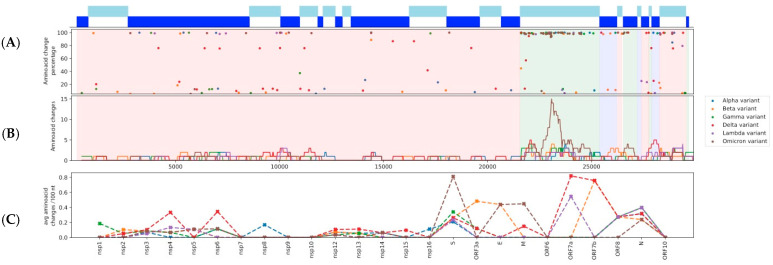
Figure 1.
(A) The distribution of amino acid substitutions (AAS) across the SARS-CoV-2 genome and their frequencies for each analyzed variant lineage. (B) A sliding window analysis of the number of AAS for a particular region. The size of the sliding window is 500 nt with a step of 20 nt. (C) Number of AAS per 100 nt, for each nsp and ORF.

