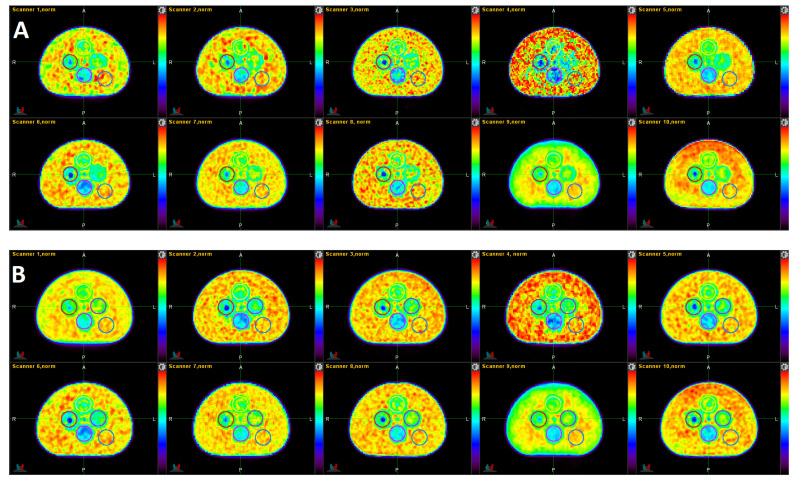
Figure 2.
Single slices of the standard (A) and harmonized (B) datasets. The order of the images follows the order in Table 1 (scanner 1 to 10 from top left to bottom right). The images were normalized by the mean activity of their respective background (Pattern-ROI-5). The displayed color scale is identical for all images and ranges from 0 (black) to 1.22 (red).

