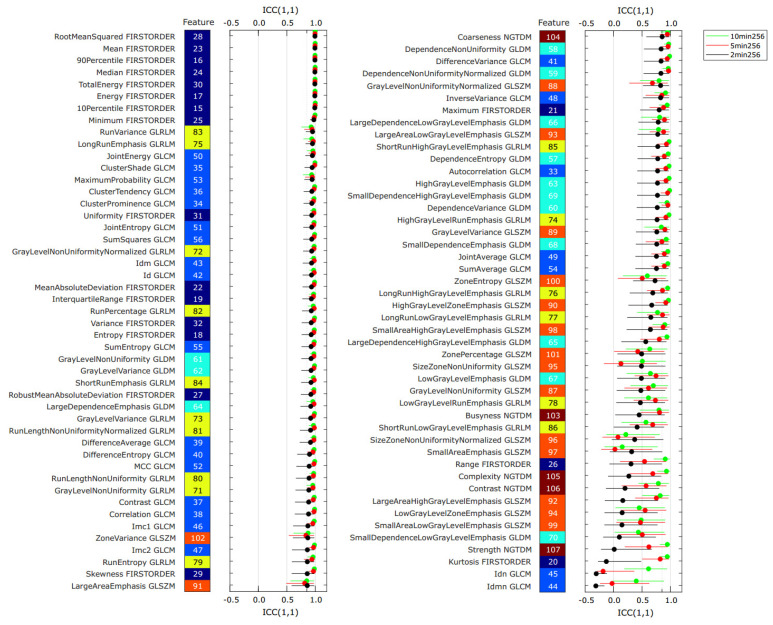
Figure 3.
Intraclass coefficient ICC(1,1) for all radiomics features from the PET images in the repeatability dataset. For each feature, three values of ICC(1,1) are plotted: binning time 10 min (green), 5 min (red), and 2 min (black). Error bars indicate the 95% confidence intervals of the ICC values. The results are sorted in descending value of ICC(1,1) for the 2 min binning time (black circles). The feature class of each feature is indicated by the color of the tiles (dark blue: first order, light blue: GLCM, cyan: GLDM, yellow: GLRLM, orange: GLSZM, brown: NGTDM).

