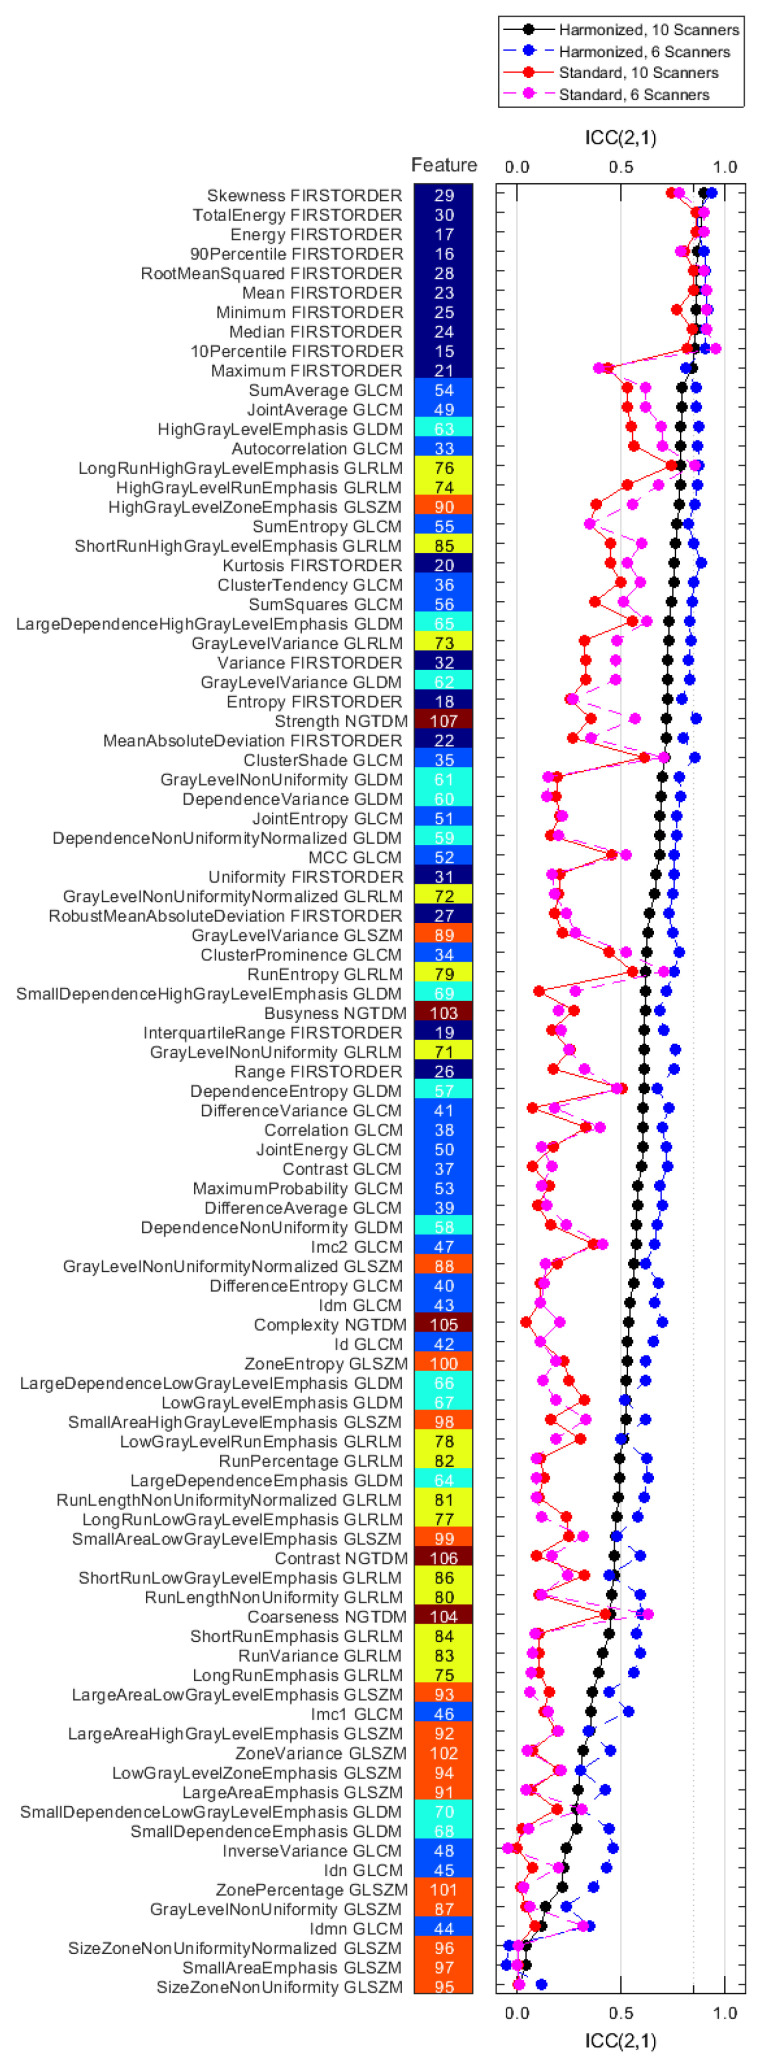
Figure 4.
ICC(2,1) values for all features for the reproducibility datasets S10, H10, S6, and H6 (Table 4), ranked by decreasing value of the H10 dataset (solid black). The feature class of each feature is indicated by the color of the tiles (dark blue: first order, light blue: GLCM, cyan: GLDM, yellow: GLRLM, orange: GLSZM, brown: NGTDM).

