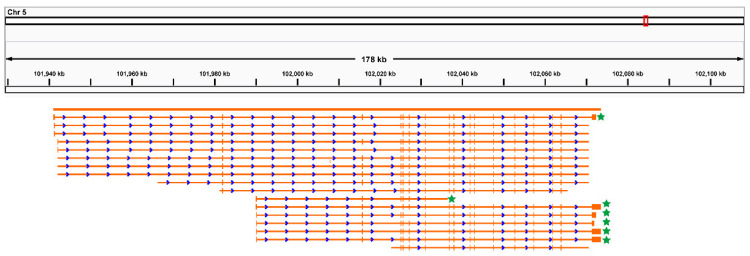
Figure 2.
Identified isoforms in CAST. The numbers at the top of the figure represent the genome coordinates. Each yellow horizontal line represents an isoform. Each yellow vertical dash represents an exon. Stars on the right denote the novel isoforms identified in the current study. Blue arrows denote the direction of transcription. Stars in right denote novel isoforms.

