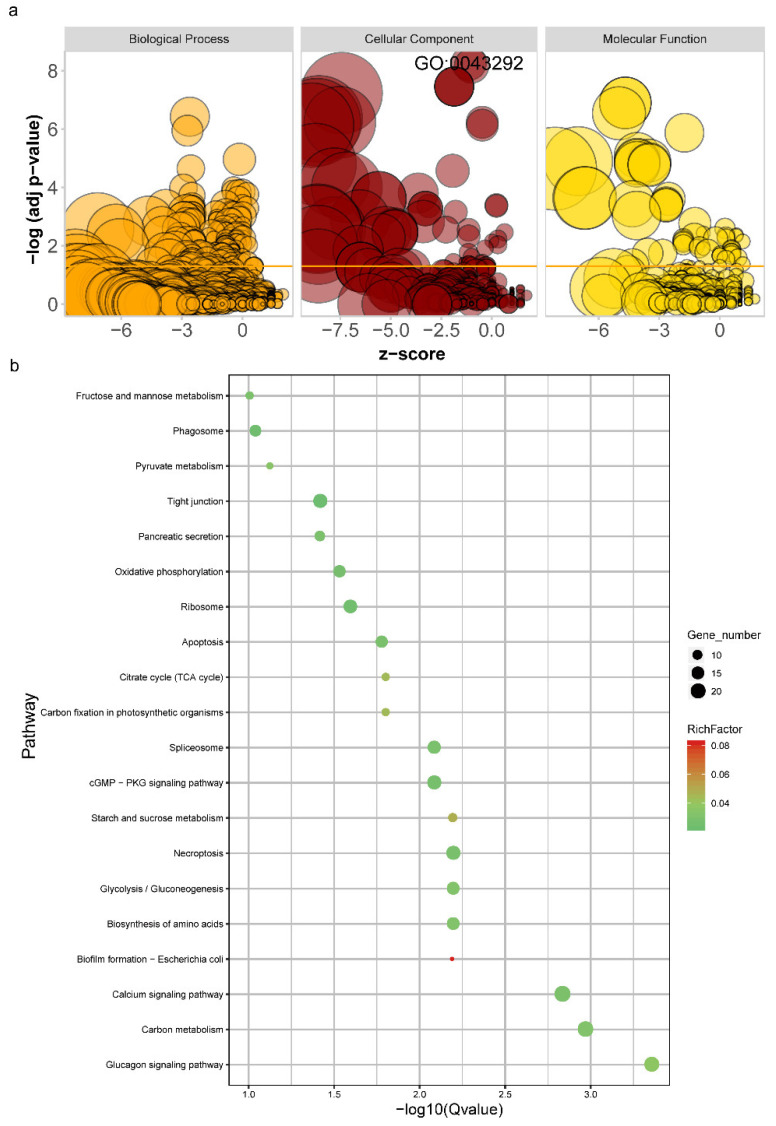
Figure 4.
Functional annotation of differentially expressed isoforms (DEIs); (a) gene ontology (GO) enrichment analysis; X-axis denotes z-score; Y-axis denotes -log10(adjusted p value); bubble size denotes the enriched gene numbers; (b) Kyoto Encyclopedia of Genes and Genomes (KEGG) enrichment analysis; X-axis denotes −log10 (adjusted p value); Y-axis denotes enriched pathway; bubble size denotes the enriched gene numbers; bubble color denotes the adjusted p value.

