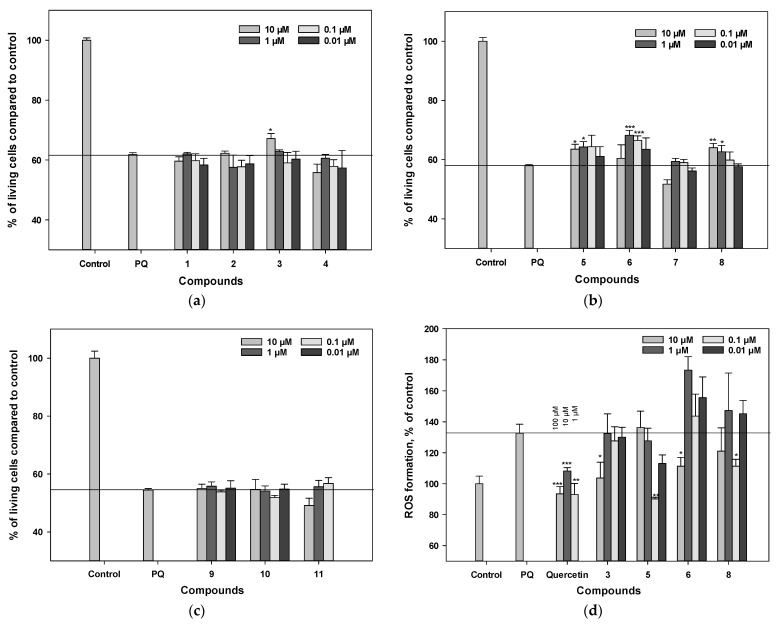
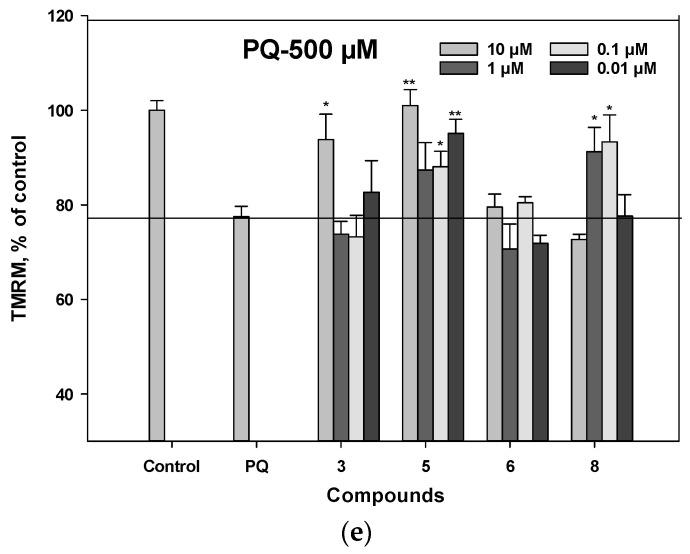
Figure 3.
The influence of polyphenolic compounds from L. bicolor on cell viability (a–c), ROS levels (d), and mitochondrial membrane potential (e) in Neuro-2a cells treated with PQ (1 mM). The percentage of living cells treated with various compounds and PQ was measured by MTT assay. Each bar represents the mean ± SEM of three independent replicates. (*), (**), and (***) indicate, respectively, p < 0.05, p < 0.005, and p < 0.001 versus PQ-treated cells. The difference between control and PQ-treated cells was considered significant.


