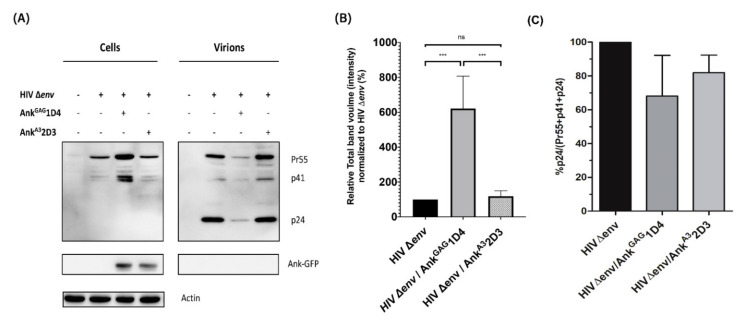
Figure 1.
The effect of AnkGAG1D4 on Gag polyprotein levels inside Gag-producing cells and virions. (A) Representative western blot images of Gag in cells and virions released from HEK293T cell after 24 h co-transfected with an HIV-1 ∆env construct, with or without pCEP4-Myr (+) AnkGAG1D4-GFP or pCEP4-Myr (+) AnkA32D3-GFP. Gag was detected using a mouse anti-CA antibody, and the expression of designed ankyrin repeat proteins was detected with an anti-GFP antibody. (B) A band-intensity histogram related to Gag proteins in cells was generated with Image lab software, and represented in a bar graph showing the relative intensity of Gag proteins normalised to HIV ∆env alone. (C) The percentage of HIV-1 Gag processing efficiency was calculated from the band intensity of HIV-1 Pr55, p41, and p24 in viral lysate using the p24/(pr55 + p41 + p24) formula. HEK293T cells transfected with pNL4-3 ∆env were used to normalise the data. Data represent the mean ± SD from the triplicate independent assay. *** p < 0.001; ns, not significant using one-way ANOVA.

