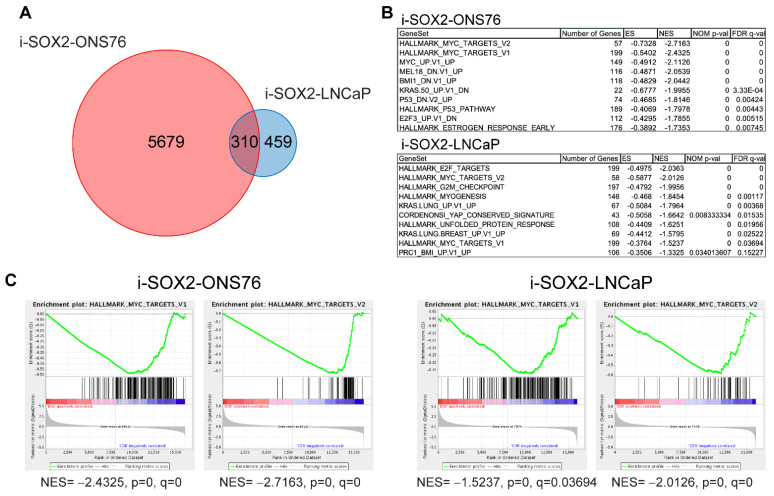
Figure 1.
RNA-seq analysis of i-SOX2-ONS76 and i-SOX2-LNCaP cells. (A) Venn diagram of differentially expressed genes (DEGs) between i-SOX2-ONS76 and i-SOX2-LNCaP cells. (B) Top 10 downregulated GSEA gene sets when SOX2 is elevated in i-SOX2-ONS76 and i-SOX2-LNCaP cells. (C) Gene set enrichment plots for MYC target genes in i-SOX2-ONS76 and i-SOX2-LNCaP.

