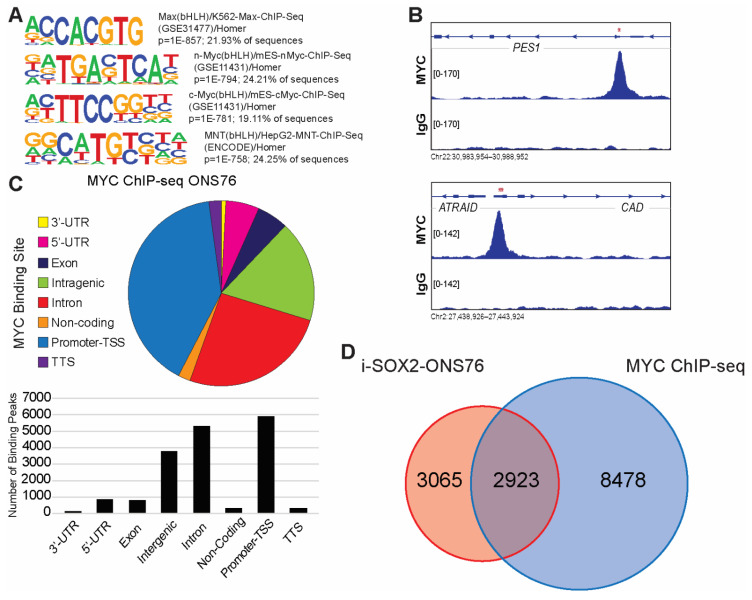
Figure 3.
ChIP-seq analysis of MYC binding peaks in ONS76 cells. (A) Motif analysis for MYC-binding sites in ONS76 cells. Significance values and percentage of ChIP-seq peaks containing the motif are indicated. (B) IGV screenshot of representative ChIP-seq peaks for MYC in ONS76 cells. PES1 contains an MYC-binding peak in a promoter/TSS region and CAD is bound near the TTS. Red asterisks indicate the position of E-boxes within the binding peaks. (C) Distribution of MYC binding peaks across regions of associated genes. (D) Venn diagram comparing i-SOX2-ONS76 DEGs and genes with associated MYC binding peaks.

