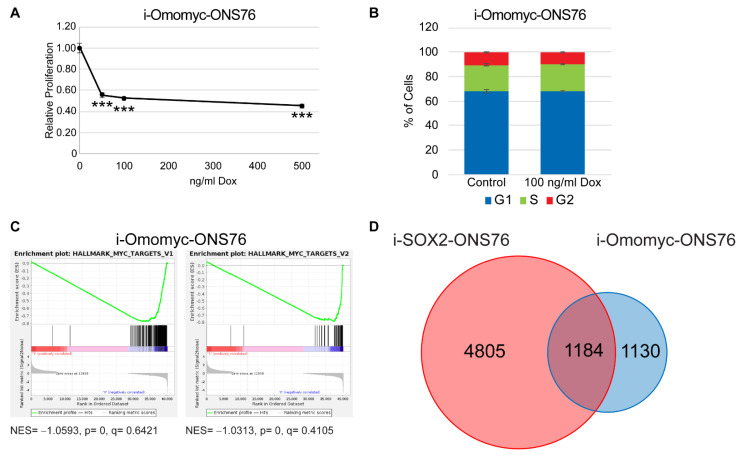
Figure 4.
Omomyc induction recapitulates the proliferative and cell cycle effects of elevated SOX2. (A) Proliferation of i-Omomyc-ONS76 cells as determined by MTT assay following 4 days of culture in the presence of Dox at the indicated doses. (B) Cell cycle analysis of i-Omomyc-ONS76 cells was performed by flow cytometry after 4 days of culture in the presence or absence of 100 ng/mL Dox. (C) Gene set enrichment plots for MYC target genes in i-Omomyc-ONS76 cells. (D) Venn diagram comparing i-SOX2-ONS76 DEGs and i-Omomyc-ONS76 DEGs. Error bars represent the standard deviation. *** p < 0.001.

