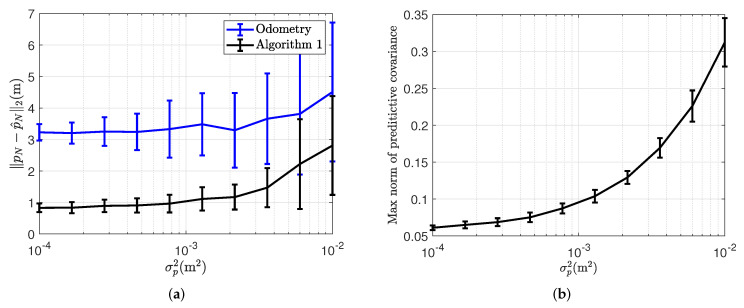
Figure 7.
Investigation of the effect of varying odometry noise on the model ship position estimate. The lines connect the average results of the ship position estimation after 100 Monte Carlo repetitions with different realisations of the simulated odometry for varying amounts of odometry noise. (a) Model ship position estimation error at the end of the trajectory for varying amounts of odometry noise. (b) The max norm of the predictive covariance of the estimate from Algorithm 1 depending on varying odometry noise.

