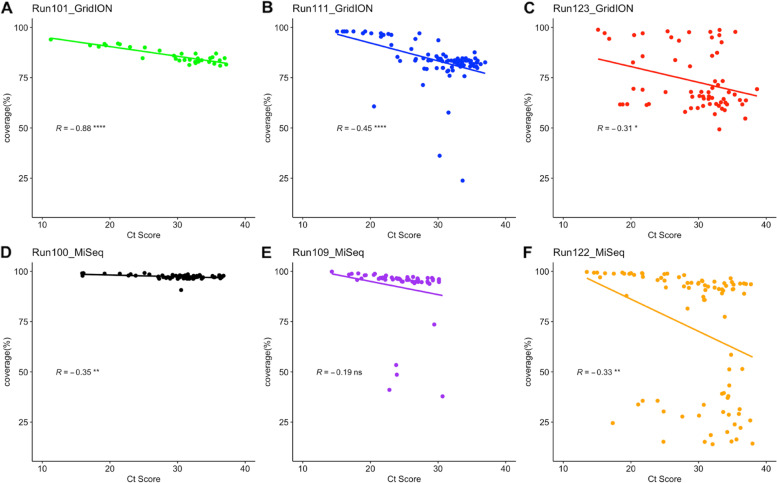
Fig. 5.
Correlation between genome coverage and Ct score for samples sequenced on the GridION and MiSeq: A correlation was performed to determine the effect of Ct score on the consensus genome coverage obtained from the GridION and the MiSeq. Genome coverage was plotted on the y-axis, whilst the sample’s average Ct score was plotted on the X-axis. GridION runs are represented by graphs A (Run101), B (Run111), and C (Run123), which are represented as green, blue, and red, respectively. MiSeq runs are represented by graphs D (Run100), E (Run109), and F (Run122) and are represented as black, purple, and gold, respectively. Statistical significance (Spearman’s rank correlation test) is represented by “*” (ns: non-significant, *: p < 0.05, **: p < 0.01, ***: p < 0.001, ****: p < 0.0001). For both platforms, as the Ct score increased, there was a decrease in genomic coverage

