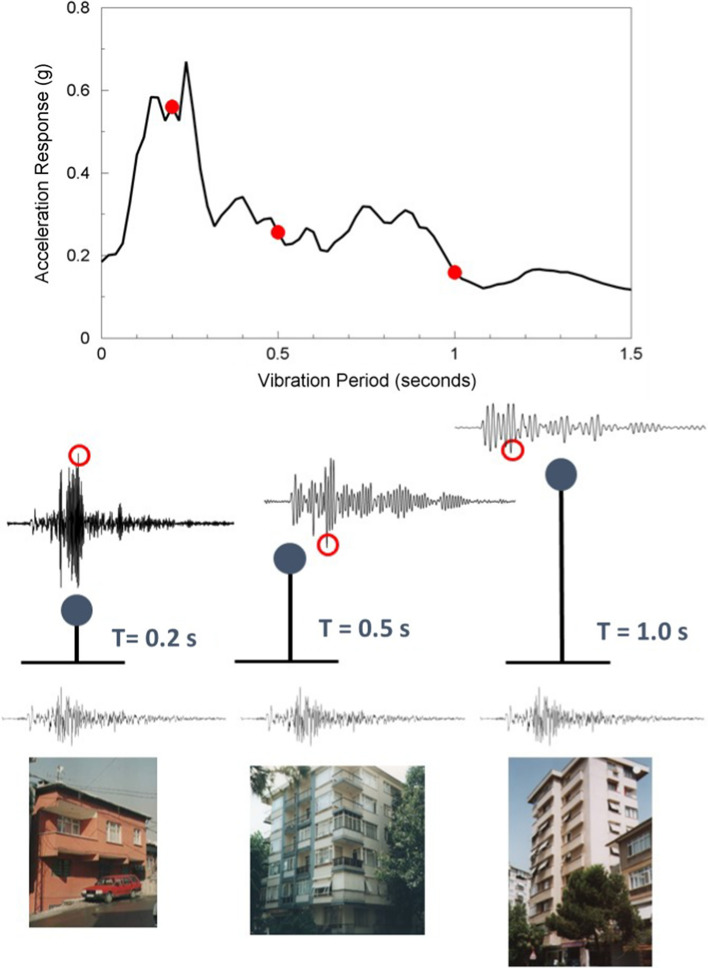
Fig. 14.
The concept of the acceleration response spectrum: structures (lowest row) are represented as equivalent single-degree-of-freedom oscillators characterised by their natural period of vibration and equivalent viscous damping (middle row), which are then excited by the chosen accelerogram and the response of the mass calculated. The maximum response is plotted against the period of the oscillator and the complete response spectrum of the accelerogram is constructed by repeating for a large number of closely-spaced periods; building photographs from Spence et al. (2003)

