Fig. 26.

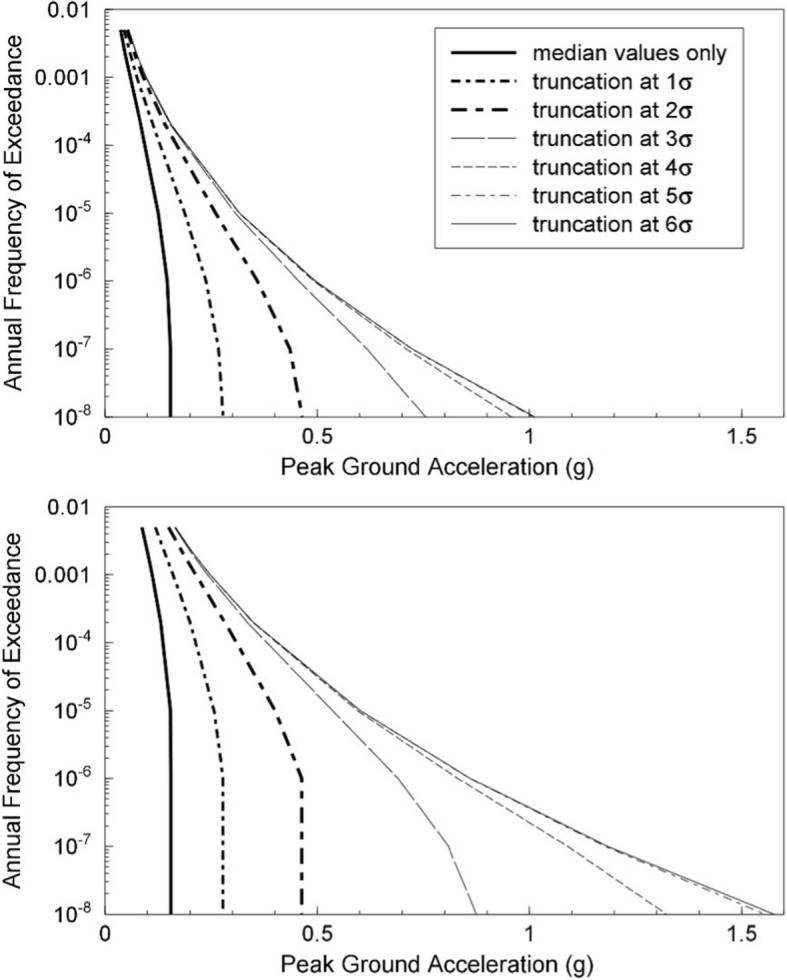
Illustration of the effect of truncating the distribution of ground-motion residuals by imposing different values of in PSHA calculations for regions of low (upper) and high (lower) seismicity rates (Bommer et al. 2004)

Illustration of the effect of truncating the distribution of ground-motion residuals by imposing different values of in PSHA calculations for regions of low (upper) and high (lower) seismicity rates (Bommer et al. 2004)