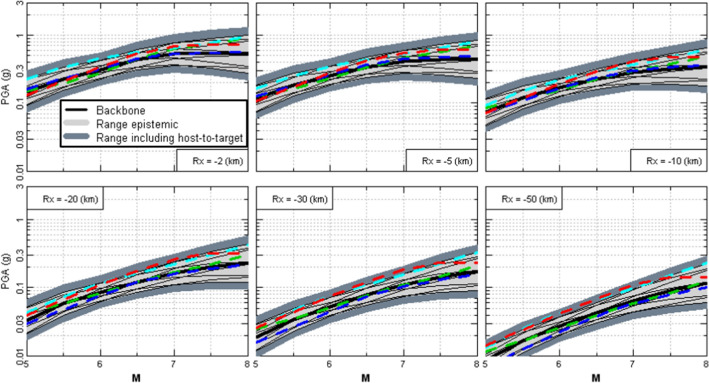
Fig. 42.
Predicted median PGA values from the Hanford GMC logic tree, as a function of magnitude for different distances. The solid black line is the backbone GMM, and the thin black lines the other models from the same host region, which collectively define the inherent uncertainty (light grey shading); the dark grey shading corresponds to the additional uncertainty associated with adjusting the backbone GMM to the characteristics of the target region and site; the dashed, coloured curves are other GMMs not used in the model development but plotted for comparative purposes (PNNL 2014)

