
Fig. 46.
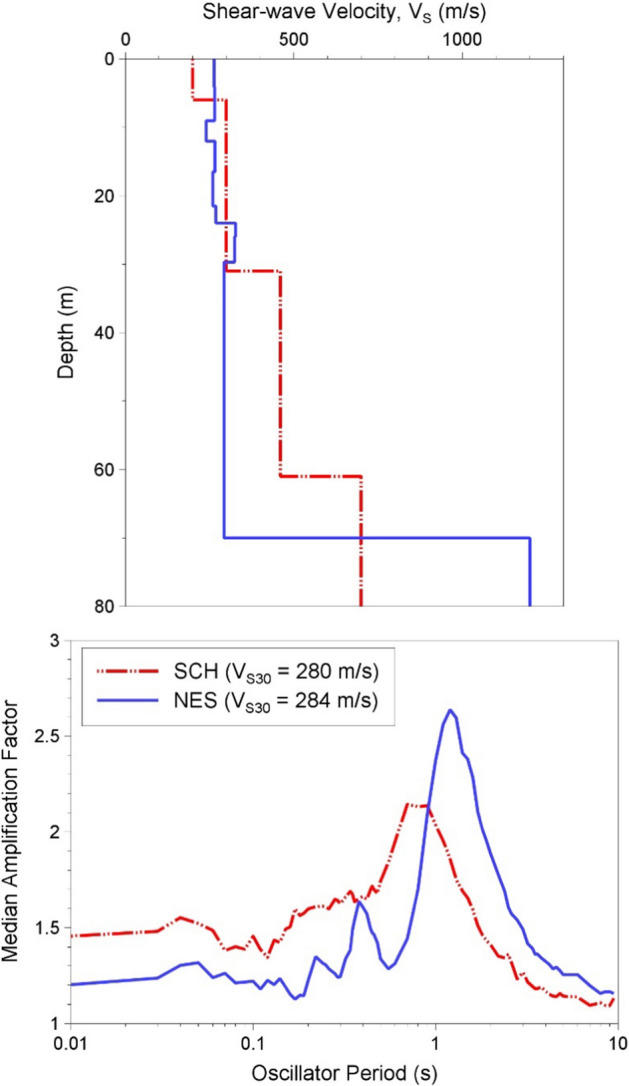
Upper: VS profiles for the sandy SCH site and the clayey NES site, which have almost identical VS30 values; lower: median amplification factors for the two sites obtained from site response analyses
(adapted from Papaspiliou et al. 2012)
Official websites use .gov
A
.gov website belongs to an official
government organization in the United States.
Secure .gov websites use HTTPS
A lock (
) or https:// means you've safely
connected to the .gov website. Share sensitive
information only on official, secure websites.
Upper: VS profiles for the sandy SCH site and the clayey NES site, which have almost identical VS30 values; lower: median amplification factors for the two sites obtained from site response analyses
(adapted from Papaspiliou et al. 2012)