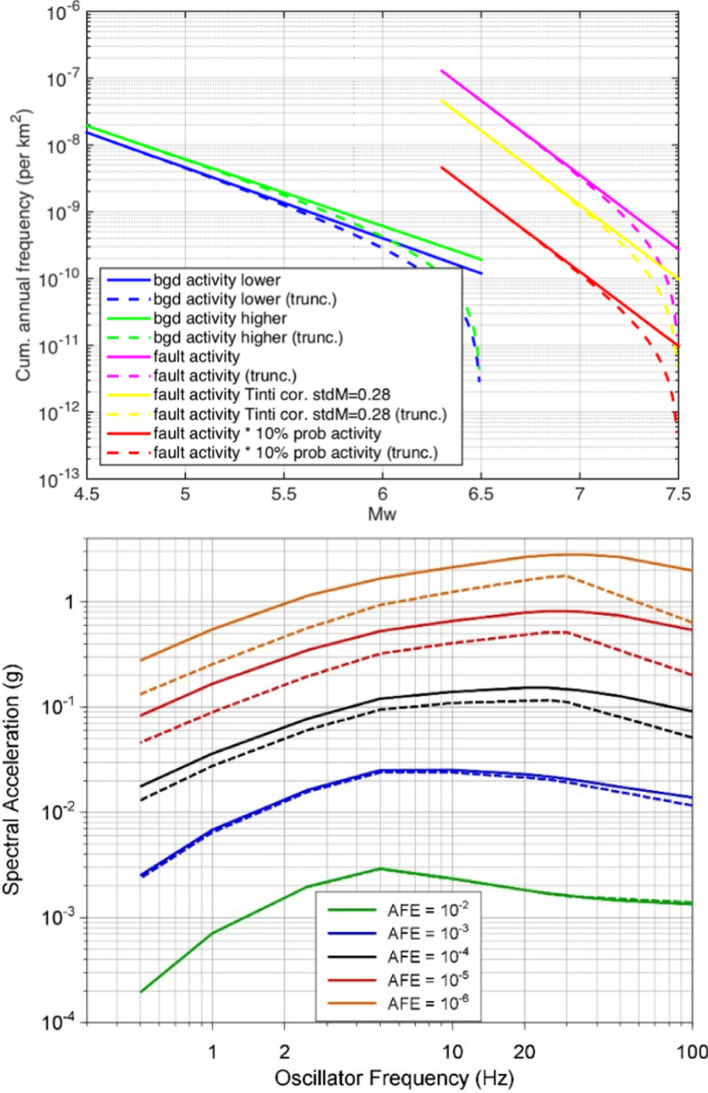
Fig. 60.
Upper: recurrence relationships for host
source zone (blue and green) and for the equivalent source for potentially active faults (purple curve from the data, red curve is the effective recurrence after applying a 10% probability of the faults being seismogenic), defined for the Angra dos Reis PSHA; lower: uniform hazard response spectra for the Angra dos Reis NPP site in Brazil obtained without (dashed lines) and with (solid lines) the contributions from the potentially active faults (Almeida et al. 2019)

