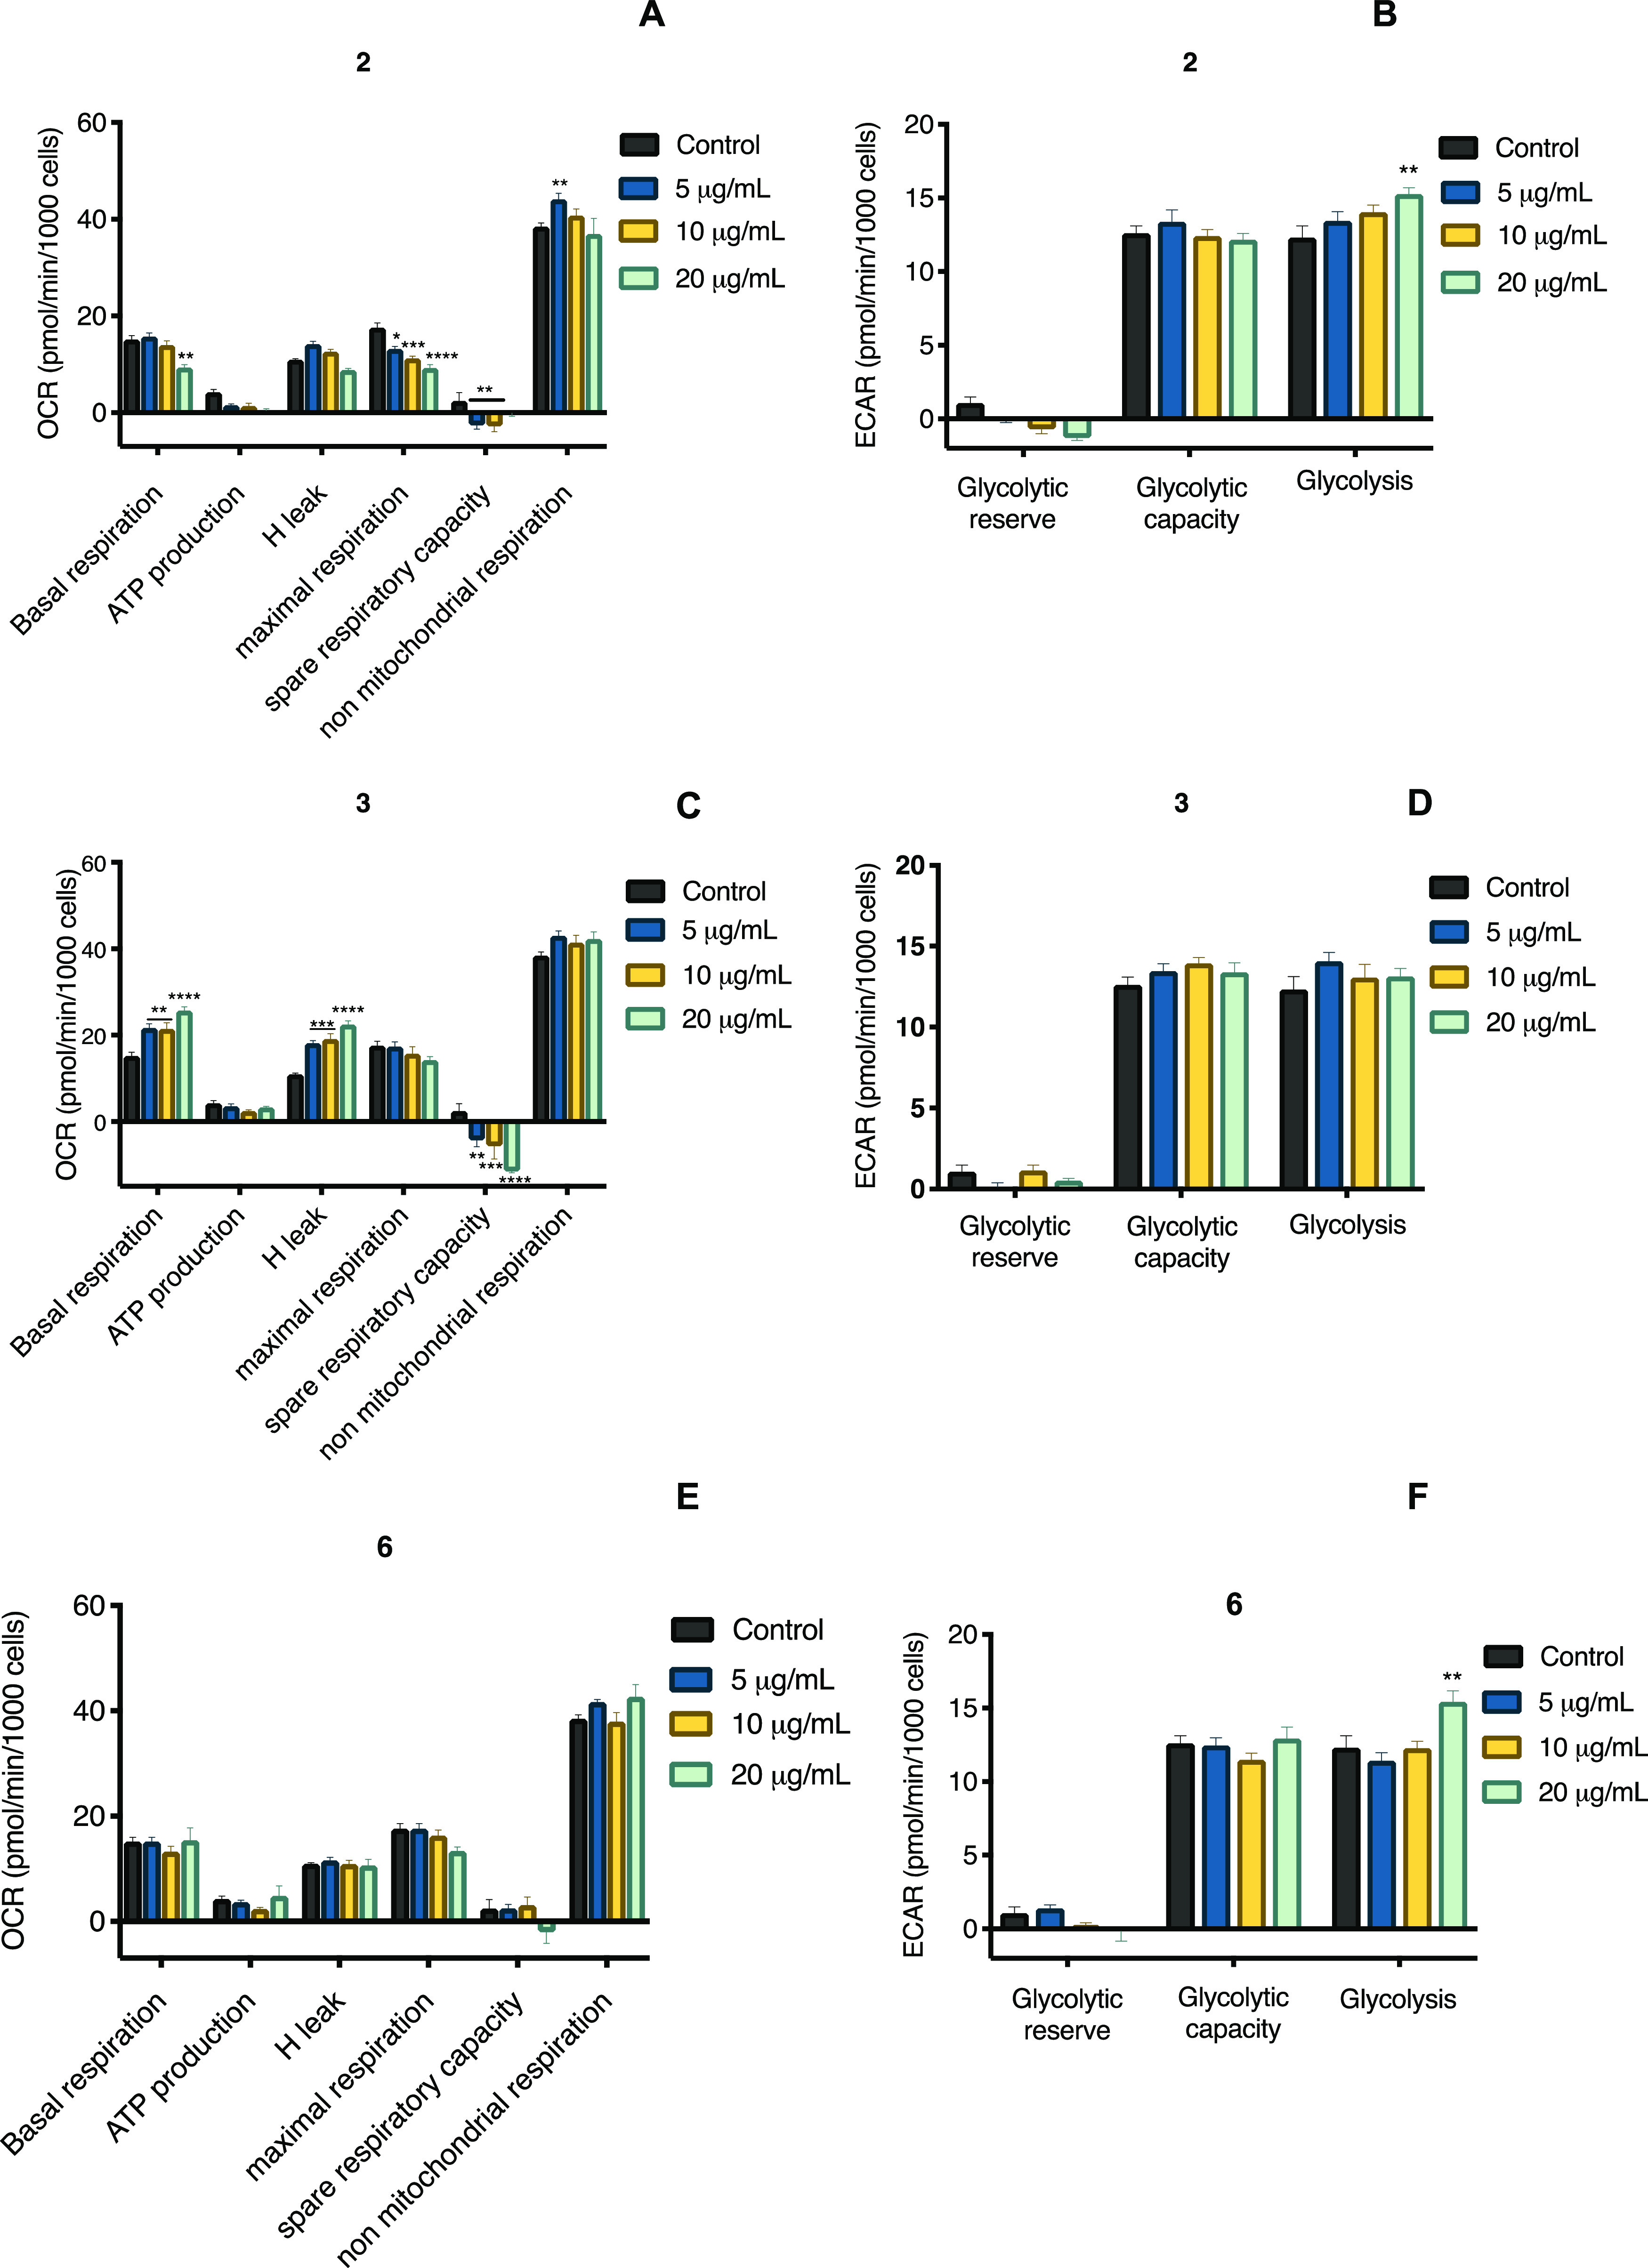
Figure 10.

(A, C, and E) Oxygen consumption rate and (B, D, and F) extracellular acidification rate in C2C12 mouse myoblast cells of compounds 2, 3, and 6. Each bar represents the mean ± SEM (n = 3). ***p < 0.01 and ****p < 0.0001 significantly different. ANOVA followed by the Tukey post hoc test for comparison with respect to control.
