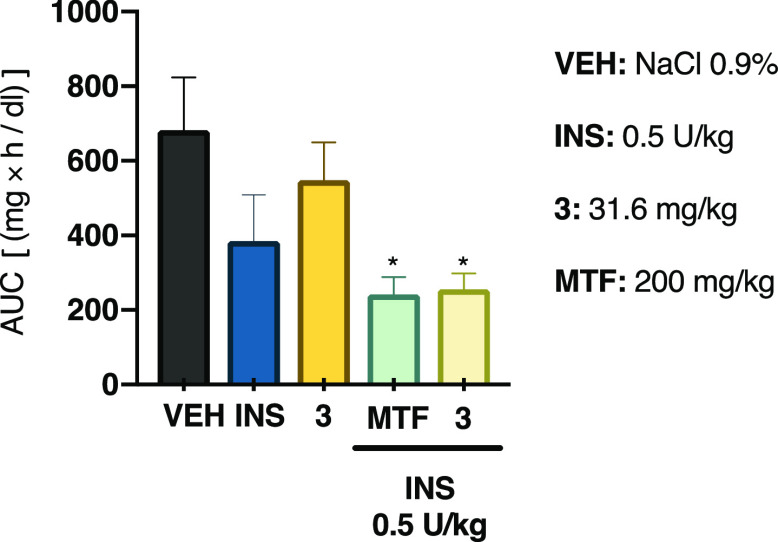
Figure 8.
Effect of compound 3 on the intraperitoneal insulin tolerance test (ITT) in NA-STZ-hyperglycemic mice. AUC: area under the curve; VEH: vehicle; INS: insulin (0.5 U/kg); MTF: metformin (200 mg/kg). Each bar represents the mean ± SEM (n = 6). *p < 0.05 significantly different. ANOVA followed by the Dunnett post hoc test for comparison with respect to vehicle control.

