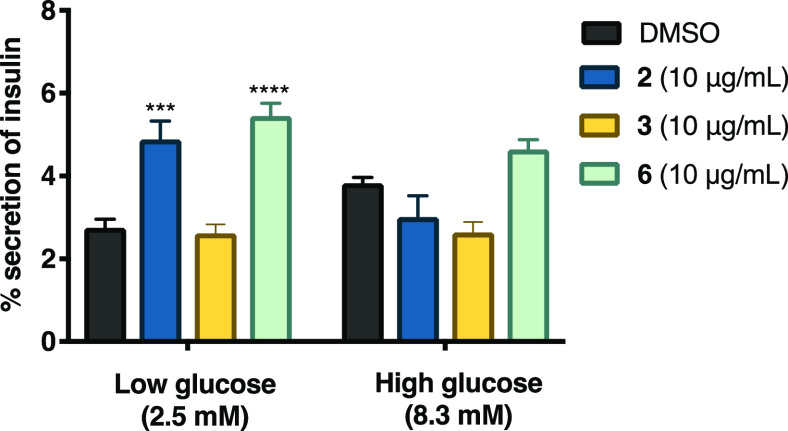
Figure 9.
Effect of compounds 2, 3, and 6 on insulin secretion in rat insulinoma. AUC: area under the curve; control: DMSO. Each bar represents the mean ± SEM (n = 3). ***p < 0.01 and ****p < 0.0001 significantly different. ANOVA followed by the Tukey post hoc test for comparison with respect to vehicle control.

