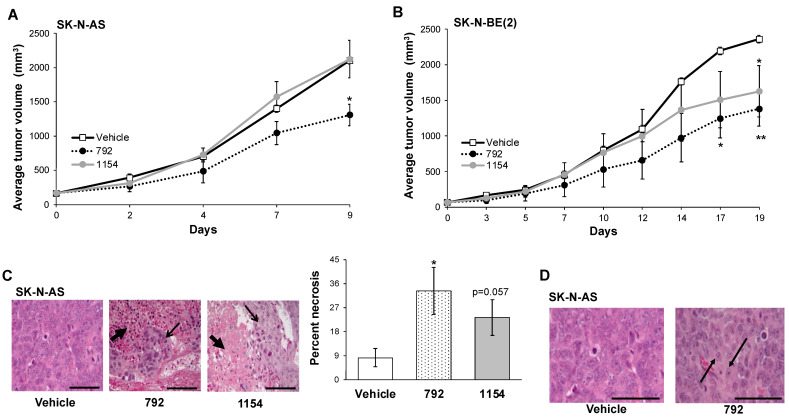
Figure 6.
In vivo evaluation of 792 and 1154. SK-N-AS (1.8 × 10⁶) or SK-N-BE(2) (1.5 × 10⁶) cells were injected into the flanks of female athymic nude mice. Treatment with vehicle, 792, or 1154 (50 mg/kg, bid, po) began once tumors reached a volume of 100 mm3 (n = 5 for SK-N-AS vehicle treated, n = 7 for SK-N-AS 792 or 1154 treatment and all SK-N-BE(2) experimental groups). Tumor volumes were measured 3 times per week, and animals were weighed weekly. (A) Animals bearing SK-N-AS tumors treated with 792 had significantly decreased tumor volumes compared to those in animals treated with vehicle or 1154. Animals treated with 1154 did not show significant decrease in tumor volume compared to vehicle-treated animals. (B) In SK-N-BE(2) tumor-bearing animals, treatment with 792 and 1154 resulted in significantly decreased tumor volumes compared to vehicle. There was no significant difference in tumor growth in animals treated with 792 compared to those treated with 1154. (C) H&E staining revealed necrosis in 792- and 1154-treated tumors (closed black arrows). Areas of viable tumor are marked with open black arrows. Percent necrosis of the SK-N-AS tumors was quantified by a pathologist blinded to the treatment groups. Percent necrosis in SK-N-AS tumors from animals treated with 792 was significantly increased compared to tumors from animals treated with vehicle (33.3 ± 8.8% vs. 8.3 ± 3.3%, 792 vs. vehicle, respectively, p ≤ 0.05). Tumors from animals treated with 1154 also demonstrated increased necrosis but when quantified, did not reach statistical significance (23.3 ± 6.7% vs. 8.3 ± 3.3%, 1154 vs. vehicle, respectively, p = 0.057). (D) H&E staining of SK-N-AS tumors treated with 792 showed the presence of ganglion cells (black arrows), which were not seen in tumors from animals treated with vehicle. Presence of ganglion cells in neuroblastoma reflects tumor cell differentiation. Data reported as mean ± SEM. Scale bars represent 0.1 mm. Student’s t-test was use for comparison. * p ≤ 0.05, ** p ≤ 0.01, compared to vehicle.

