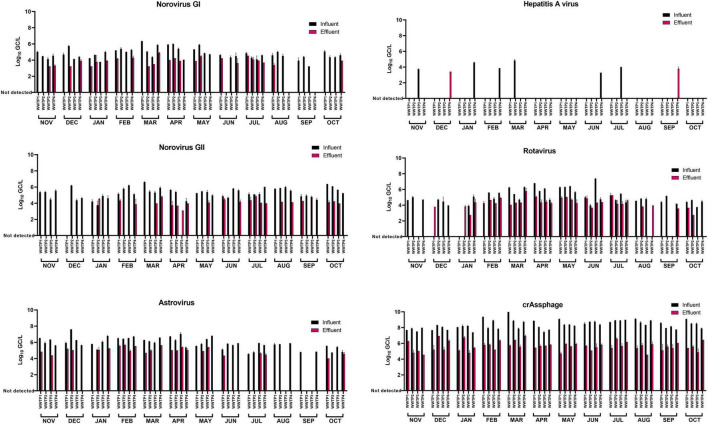
FIGURE 2.
Occurrence of intact capsid enteric viruses and crAssphage in influent and effluent wastewater samples over a 1-year period. Capsid integrity was assessed by PMAxx-RT-qPCR. Colored bars represent mean Log10 GC/L values of two technical RT-qPCR replicates for each concentrated sample. Error bars indicate standard deviation.

