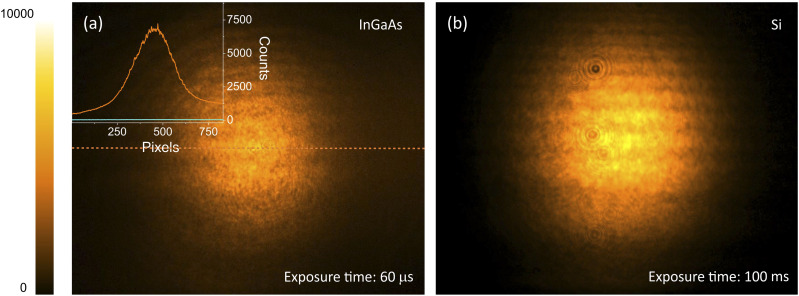
FIG. 2.
(a) 4250 nm (∼2350 cm−1) single shot detection by an InGaAs camera using 60 µs exposure time. The MIR average power is 130 µW. The inset shows the spatial cross section of the beam profile on the camera chip (orange curve) when both MIR and gate pulses are present. The light blue curve shows the DTA background when only the 1900 nm gate beam is present. (b) 3840 nm (∼2600 cm−1) pulse train detection on a Si CCD camera using 100 ms exposure time. The average power is 1 mW.

