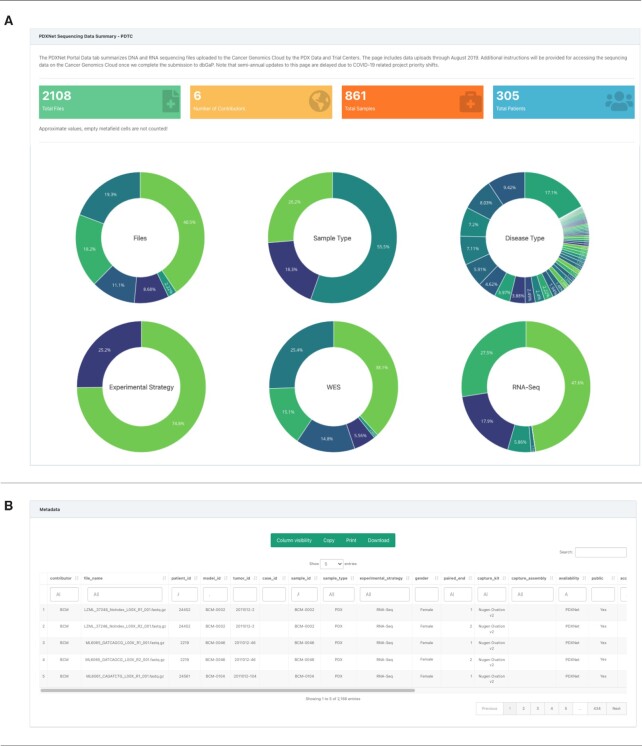
Figure 2.
PDXNet sequencing data page on the PDXNet Portal Components of the PDXNet sequencing data page. (A) Panel shows summary statistics including number of sequencing files (green), contributors (yellow), total samples (orange) and total patients (blue). Also, shown are donut plots for contributors, sample types, disease type, experimental strategy, WES contributors and RNA-Seq contributors. (B) Panel shows metadata for the PDXNet sequencing data in a spreadsheet format. The interface supports searching and sorting metadata. Users can copy, print, and download metadata into accessible formats.

