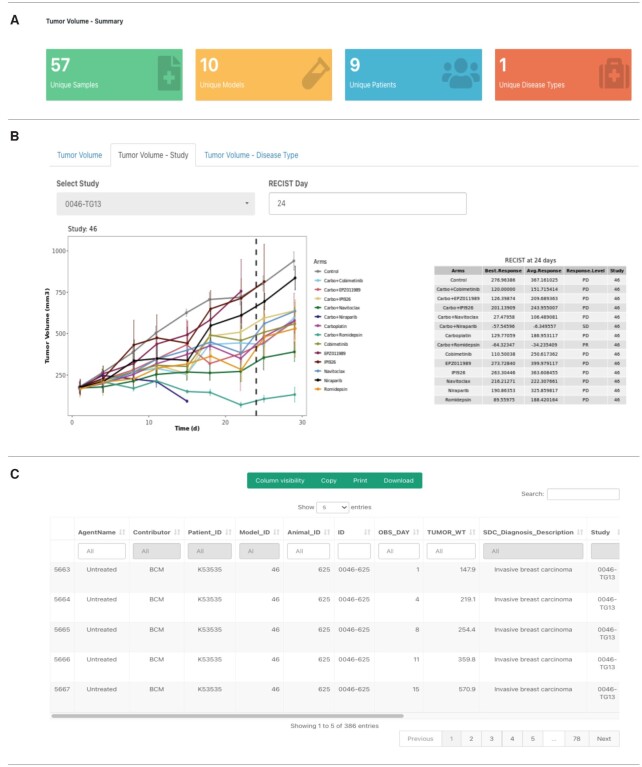
Figure 4.
Tumor volume data page on the PDXNet Portal Components of the PDXNet tumor volume page. The figure shows a filtered dataset. (A) Panel shows summary statistics including number tumor volume datasets (green), number of models in the selected dataset (yellow), total number of patients (blue), and total number of diseases represented (red). (B) Panel shows the tumor volume data organized by study and automatically computed resist category for each treatment arm. (C) Panel shows the tumor volume response and metadata in a spreadsheet format. The interface supports searching and sorting metadata. Users can copy, print, and download metadata into accessible formats

