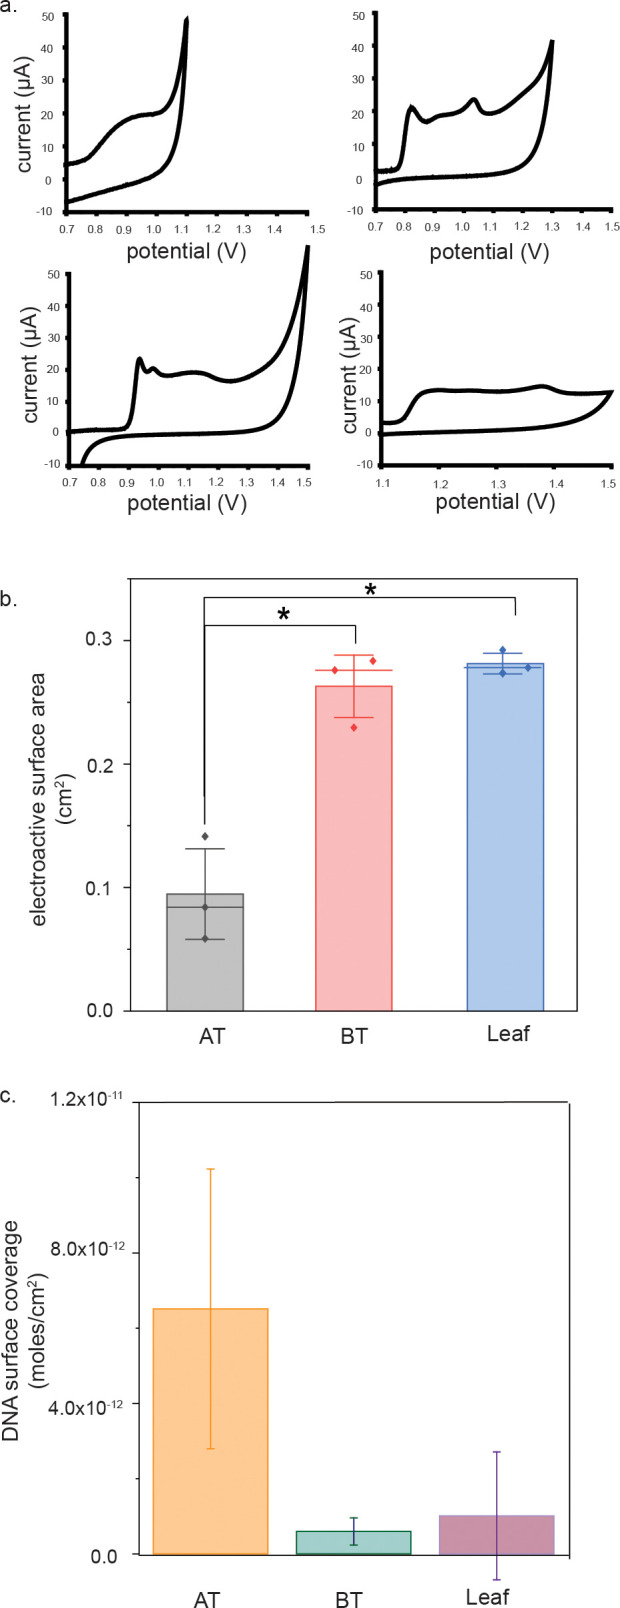
Figure 2.

Electroactive surface area determination. (a) Oxidative peaks of cyclic voltammograms of bare electrodes in 0.5 M H2SO4 for AT (top left), BT (top right), leaf (bottom left), and rod electrodes (bottom right). BT, leaf, and rod electrodes show characteristics of crystalline gold. (b) AT electrodes have the smallest electroactive surface area. (c) Oligonucleotides are most densely packed on the AT electrodes.
