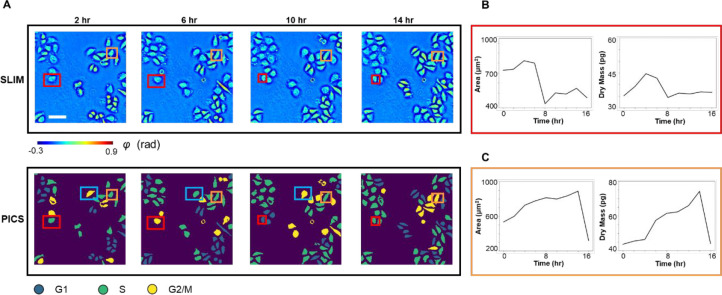
Figure 5.
PICS on time lapse of FUCCI-HeLa cells. (A) SLIM images and PICS inference of cells measured at 2, 6, 10, and 14 h. The time interval between imaging is roughly 2 h. We manually tracked two cells (marked in red and orange). (B) Cell area and dry mass change of the cell in the red rectangle, across 16 h. These values were obtained via PICS inferred masks. We can observe an abrupt drop in cell dry mass and area as the cell divides after around 8 h. (C) Cell area and dry mass change of the cell in orange rectangle, across 16 h. We can observe that the cell continues growing in the first 14 h as it goes through G1, S, and G2 phase. It divides between hour 14 and hour 16, with an abrupt drop in its dry mass and cell area. Scale bar is 100 μm.

