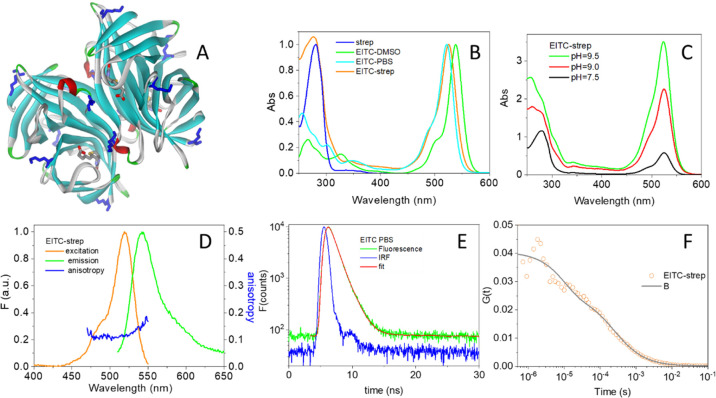
Figure 1.
(A) Three-dimensional structure of strep from Streptomyces avidinii (PDB code 1n43, solid ribbon) bound to four biotin molecules. The Lys residues on strep are shown as blue sticks. The four biotin molecules bound to strep are shown as sticks. (B) Normalized absorption spectra of strep in PBS buffer at pH = 7.4 (blue), EITC in DMSO (green), EITC in PBS buffer (cyan), and the complex EITC–strep (at DOL ∼ 1) in PBS buffer at pH = 7.4 (orange). The absorption spectra were normalized at 280 nm (strep), 538 nm (EITC in DMSO), 521 nm (EITC in PBS), or 525 nm (EITC–strep in PBS). (C) Normalized absorption spectra of EITC–strep in PBS, pH = 7.4, purified after reaction at pH = 7.5 (black), pH = 9 (red), and pH = 9.5 (green). The spectra were normalized to the absorbance of the protein at 280 nm. (D) Normalized fluorescence excitation (orange, peak at 525 nm, emission collected at 580 nm) and emission (green, peak at 541 nm, excitation at 500 nm) for an EITC–strep solution in PBS buffer at pH = 7.4. Fluorescence excitation anisotropy is reported in blue (emission collected at 560 nm). (E) Fluorescence decay (TCSPC) for EITC in PBS buffer (green) compared with the IRF (blue). Excitation at 500 nm, detection at 600 nm. Best fit (red curve) was obtained with an exponential decay of lifetime τF = 1.1 ± 0.1. (F) Autocorrelation curve for EITC–streptavidin at DOL ∼ 1 (orange circles). Excitation was at 475 nm, detection at 550(20) nm in the cross-correlation mode. The solid curve is the result of a fit with a single diffusing species with diffusion coefficient D = 49 μm2/s and a triplet state with τT = 20 μs. In the reported experiment, about 25 molecules were present on an average in the confocal volume.

