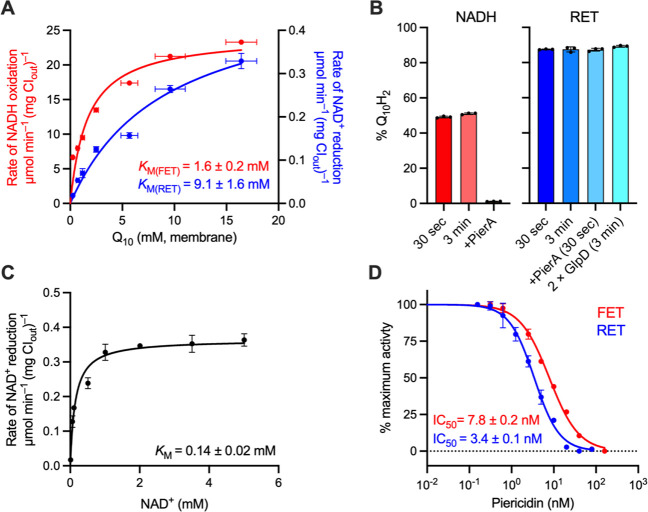
Figure 4.
Kinetic parameters for FET and RET by bovine complex I in proteoliposomes. (A) Dependence of the rates of NADH oxidation (FET, blue) and NAD+ reduction (RET, red) on Q10 concentration in the membrane (1 mM Q10 (membrane) = 1 nmol Q10 per mg of phospholipid). RET activities were recorded with 100 μg mL–1 GlpD. The Vmax values are 24.4 ± 0.85 and 0.50 ± 0.04 μmol min–1 (mg CIout)−1 (± S.E. of the fit). (B) Estimation of the level of Q-pool reduction for proteoliposomes reduced by NADH or catalyzing RET. For NADH measurements, no AOX was present and the Q-pool in 5 μg mL–1 CIout proteoliposomes was reduced by addition of 200 μM NADH. For RET measurements, GlpD was present at 100 μg mL–1 and RET was initiated as described in Experimental Procedures before being quenched at the time specified. (C) Dependence of the rate of NAD+ reduction on NAD+ concentration. RET was measured under standard conditions with proteoliposomes reconstituted with 10 nmol Q10 (mg lipid)−1. The Vmax value was 0.36 ± 0.01 μmol min–1 (mg CIout)−1. (D) Dependence of the rates of NADH oxidation (FET) and NAD+ reduction (RET) on piericidin A concentration. All measurements performed with 2 μg mL–1 CIout. See Experimental Procedures for standard assay conditions. All data are mean averages with error (± S.D.) values from triplicate technical replicates (including propagated error from underlying measurements in (A)).

