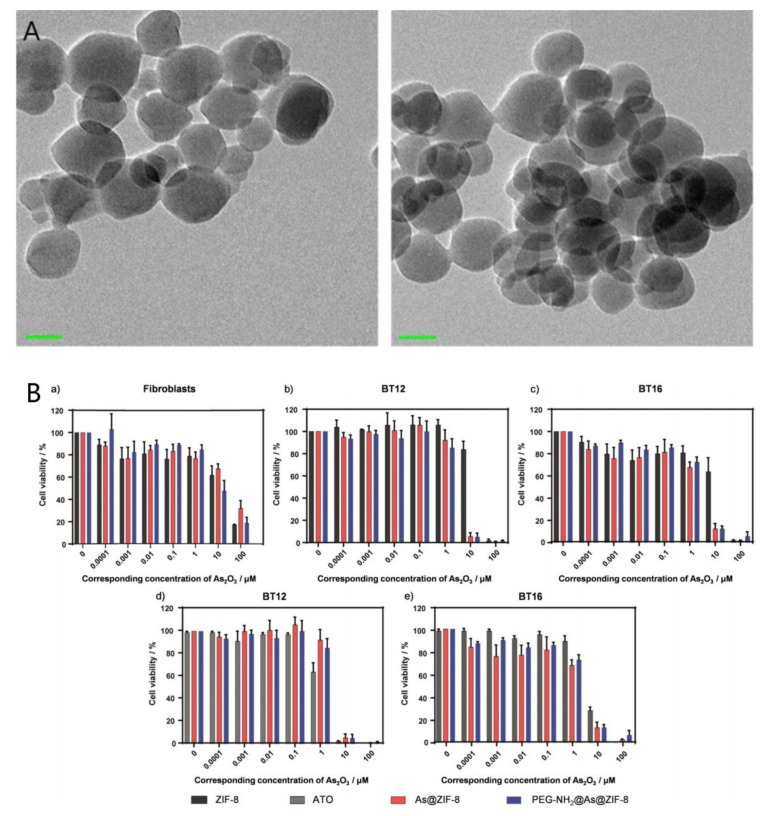
Figure 7.
(A) TEM image of ZIF-8 nanoparticles before (left) and after the As drug loading, scale bar: 50 nm. (B) Cell viability of (a) fibroblasts, (b,d) BT12- and (c,e) BT16 cells after 72 h of incubation with different concentrations of ZIF-8 (black), ATO (grey), As@ZIF-8 (red) or PEG-NH2@As@ZIF-8 (blue). The given concentrations correspond to the As2O3 (0–100 mm) effectively loaded. Reproduced from ref. [86], Wiley-VCH, 2019.

