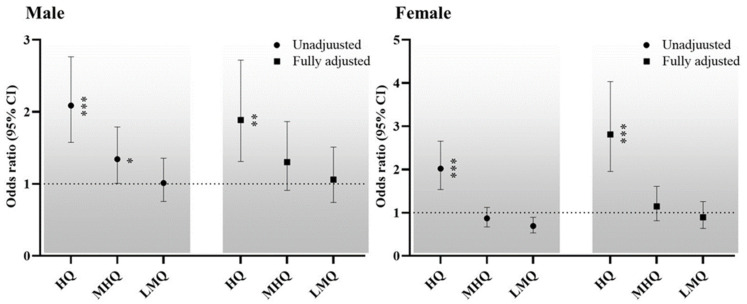
Figure 2.
Sex-specific ORs for the relationship between ABSI and osteoporosis. Dotted line: reference; solid line: 95% confidence interval; Black circle: ORs. * p < 0.05, ** p < 0.01, *** p < 0.001 for the ORs for osteoporosis, compared with the lowest quartiles. Abbreviations: HQ, highest quartile; MHQ, middle-high quartile; LMQ, low-middle quartile.

