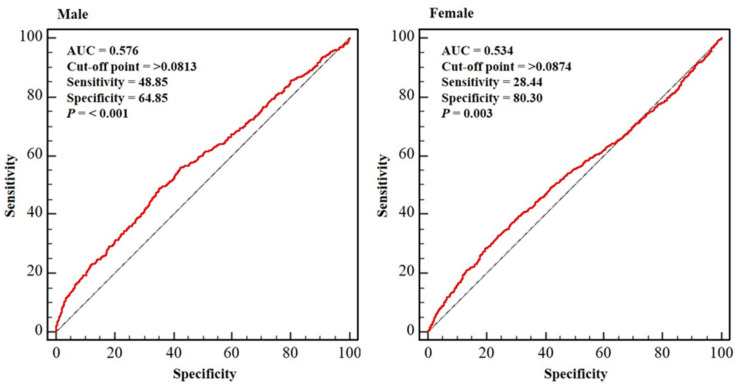
Figure 3.
Sex-specific ROC curves indicating the ABSIs in the Osteoporosis group. Dotted blue line: reference; solid red line: area under the curve (AUC), indicating the accuracy of the A Body Shape Index (ABSI) for the identification of osteoporosis; cut-off value: the value of ABSI that predicts osteoporosis; sensitivity: the probability of individuals who actually have osteoporosis to be predicted to have osteoporosis; specificity: the probability of individuals who do not have osteoporosis to be predicted not to have osteoporosis. Abbreviation: AUC, area under curve.

